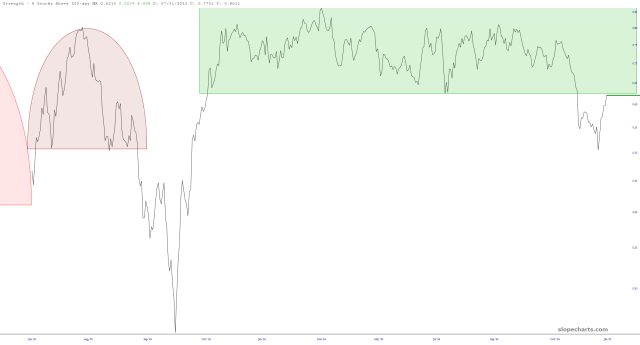
Below is $SPX200MA which is the symbol representing the percentage of stocks above their 200-day moving average. Although this is a derived number, it appears quite adept at forming its own patterns. I’m curious to see if the recent bounce to that mass of green represents a point of resistance for the market as whole.