In my last post on Friday I was saying that Bitcoin (BTCUSD) had just broken over the previous week’s high at 102.7k and, as I noted on Monday 13th Jan, that was the right shoulder high on the H&S that had broken down. The break up on Friday invalidated that H&S and that break fixed a target at the retest of the all time high at 108.4k.
That target at the retest of the all-time high was reached quickly amid a wild weekend with the launch of Trump and Melania’s astonishingly popular meme coins, and that leaves a possible large double top setup on Bitcoin that I am not taking particularly seriously at this stage.
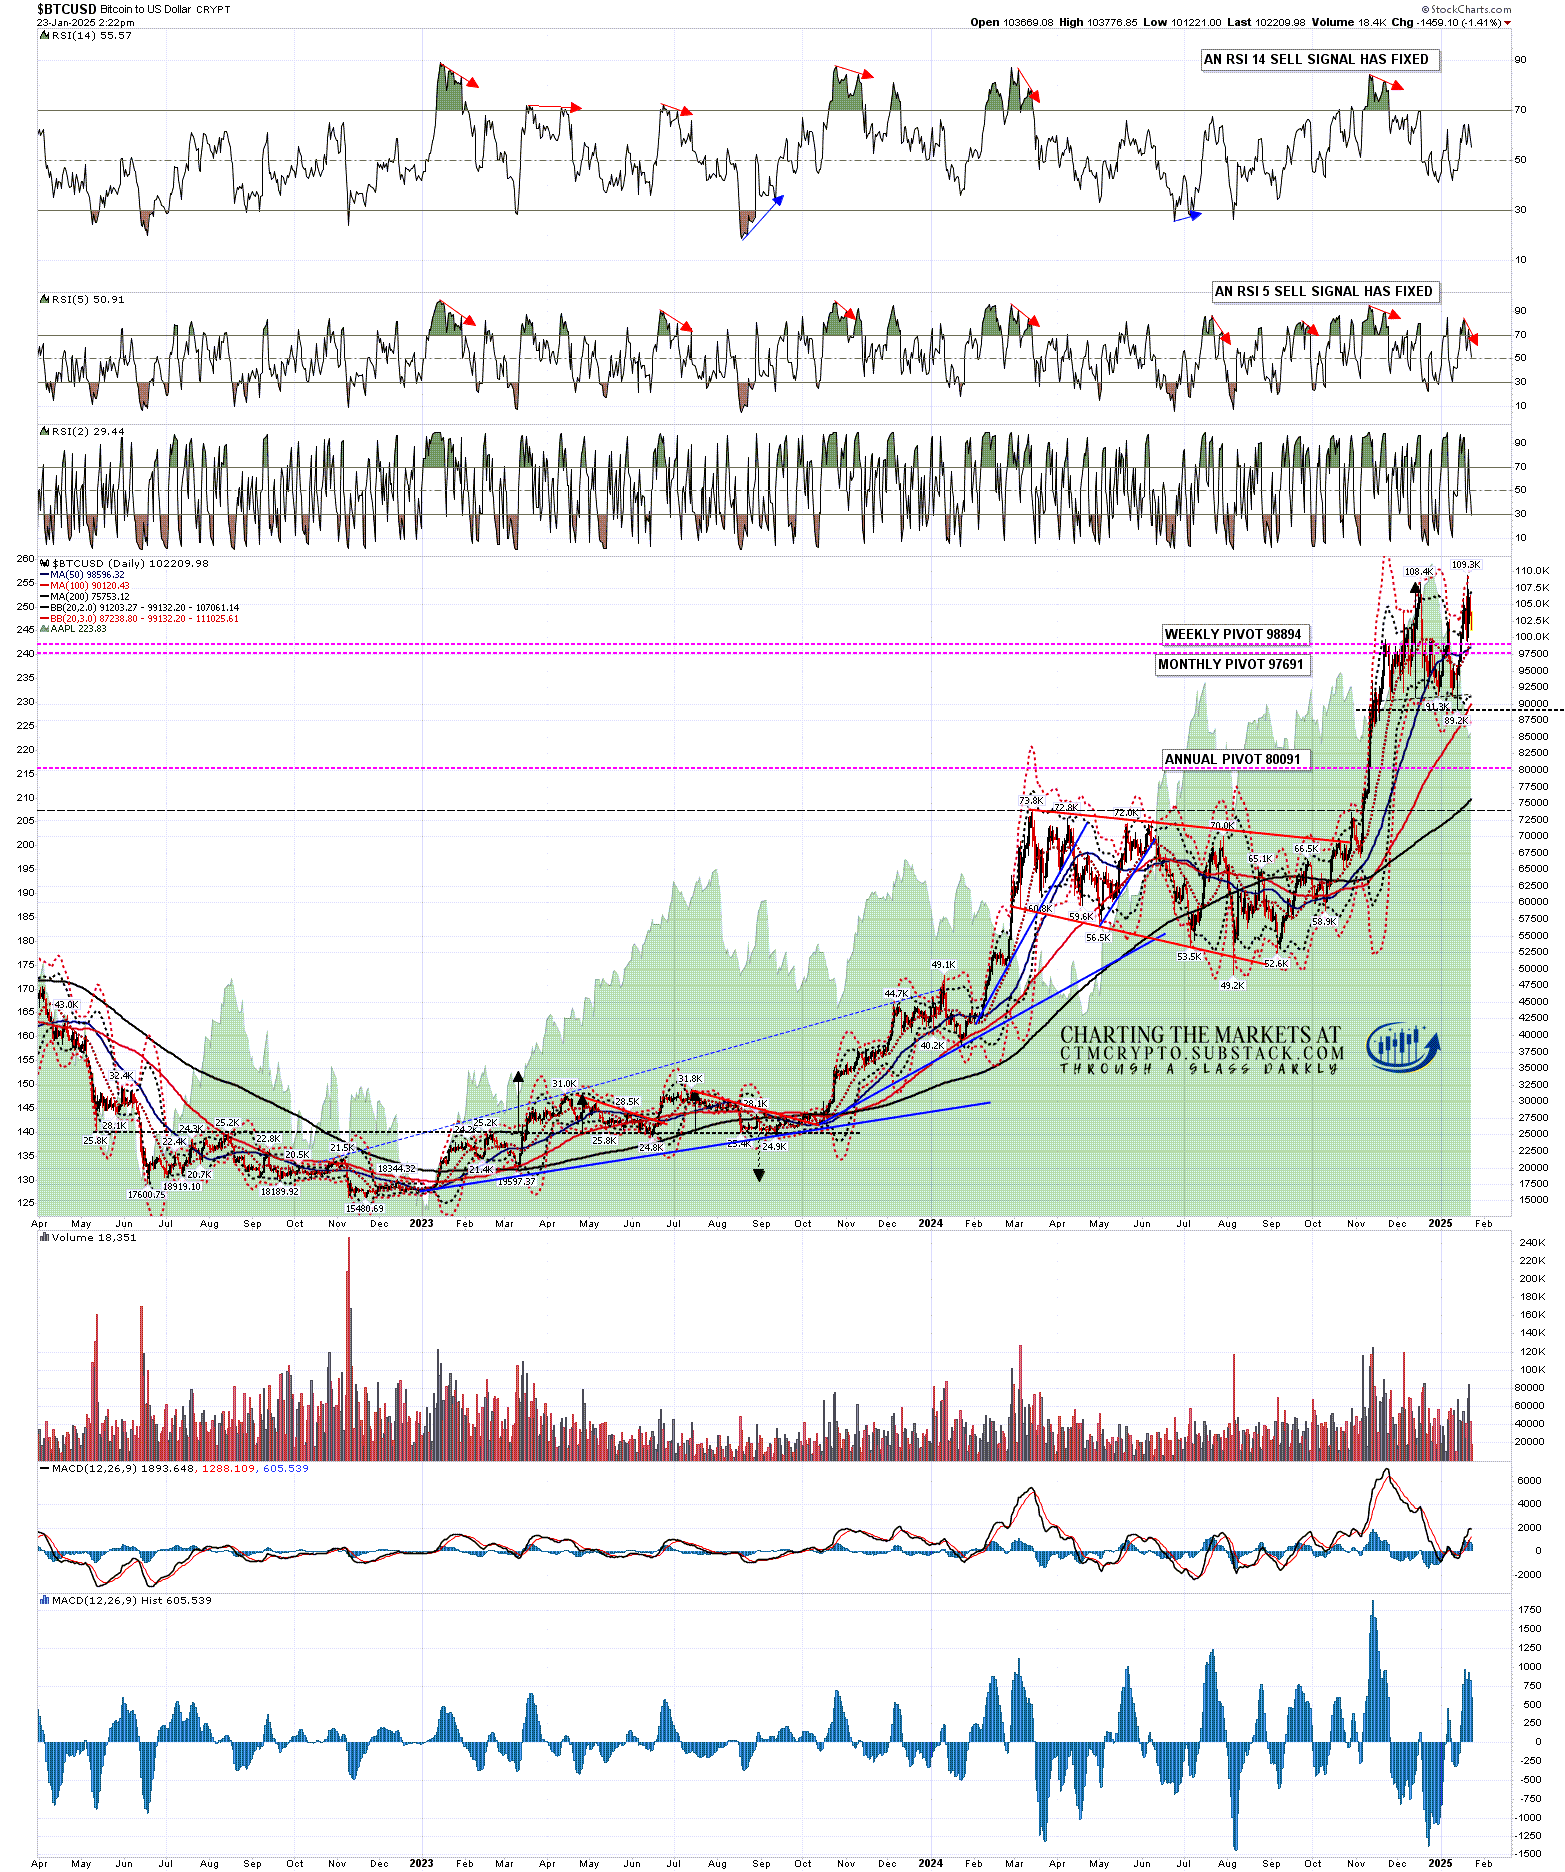
Bitcoin has been consolidating after the new all time high and that process does not look finished, with a daily RSI 5 sell signal having fixed overnight. These signals have a target at the 30 level on the RSI 5 and the six of the last seven of these on the chart below reached that target, with the other being a near miss. There is also an older open RSI 14 sell signal on this chart, and of the previous five on the chart below, three of those made the full target with two near misses.
All of those signals were during the current bull market and, while there is no certainty about any of these signals ever reaching target, the history of success is strong, and I’m expecting the current ones to make target or at least a near miss in due course.
BTCUSD daily chart:
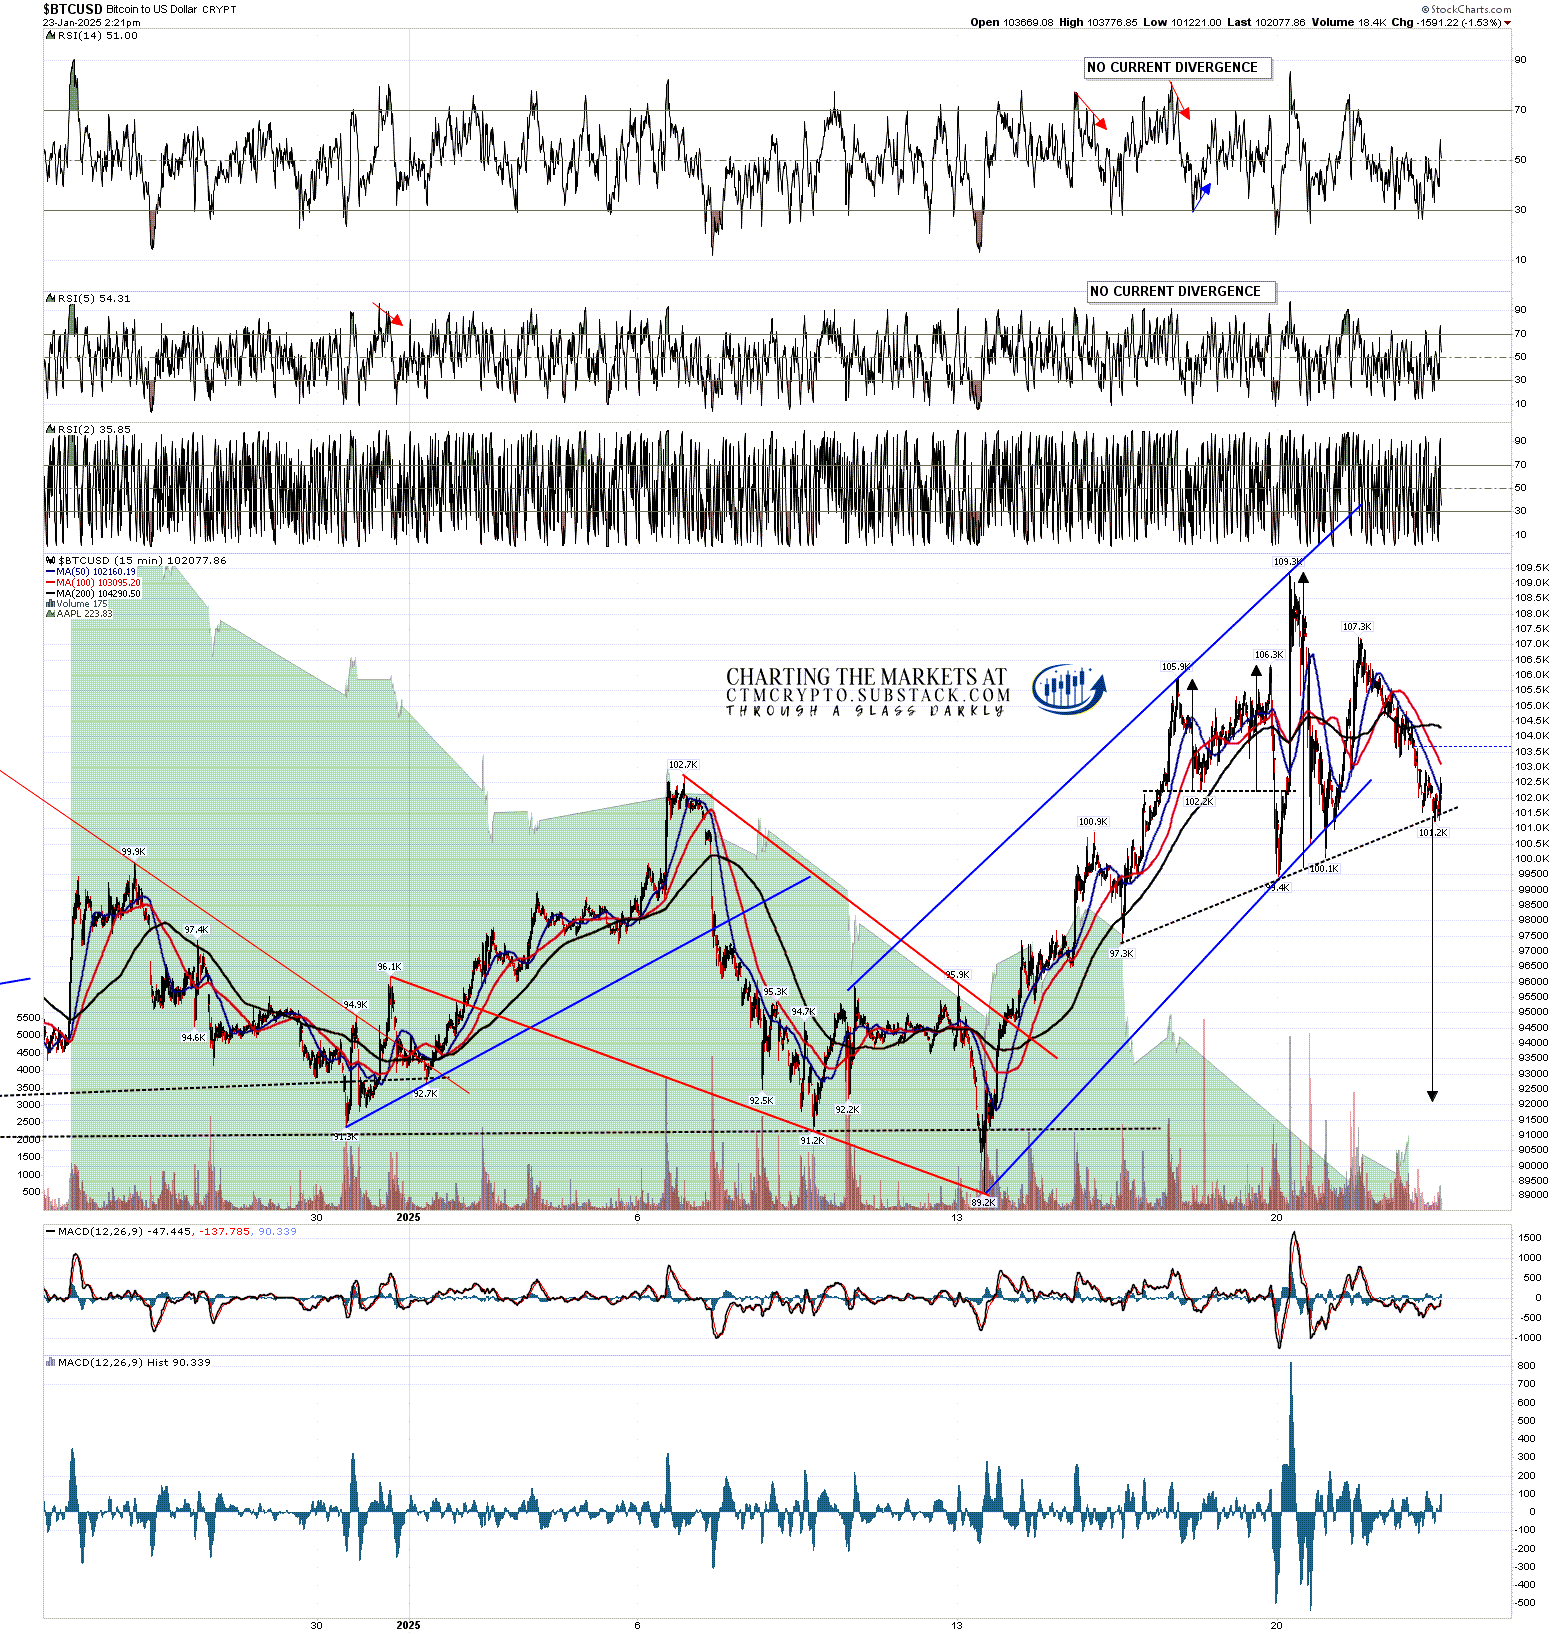
In this context I was looking at a good quality H&S on Bitcoin this morning, in my premarket video, that broke down overnight with a target in the 92,000 area. I was saying that, as is usual with these patterns, there were two clear targets, either that Bitcoin would head down to the target, or that it would reject back up into a retest of the new all time high at 109.3k. I further noted that the most usual time for an H&S to break down and then fail would be just after the break down.
I also said that I was leaning towards rejection back into the highs despite the fixed daily RSI 5 sell signal and that the target to invalidate the H&S would be a break back up over the H&S right shoulder high at 107.3k. At the time of writing Bitcoin has since rallied to 106.9k, and is close to invalidating the H&S. On a break over the 107.3k high the target would be a retest of the all time high at 109.3k. Given the fixed daily RSI 14 and RSI 5 daily sell signals here though, a retest of the all time high on Bitcoin next may set up a small double top that may then deliver.
BTCUSD 15min chart:
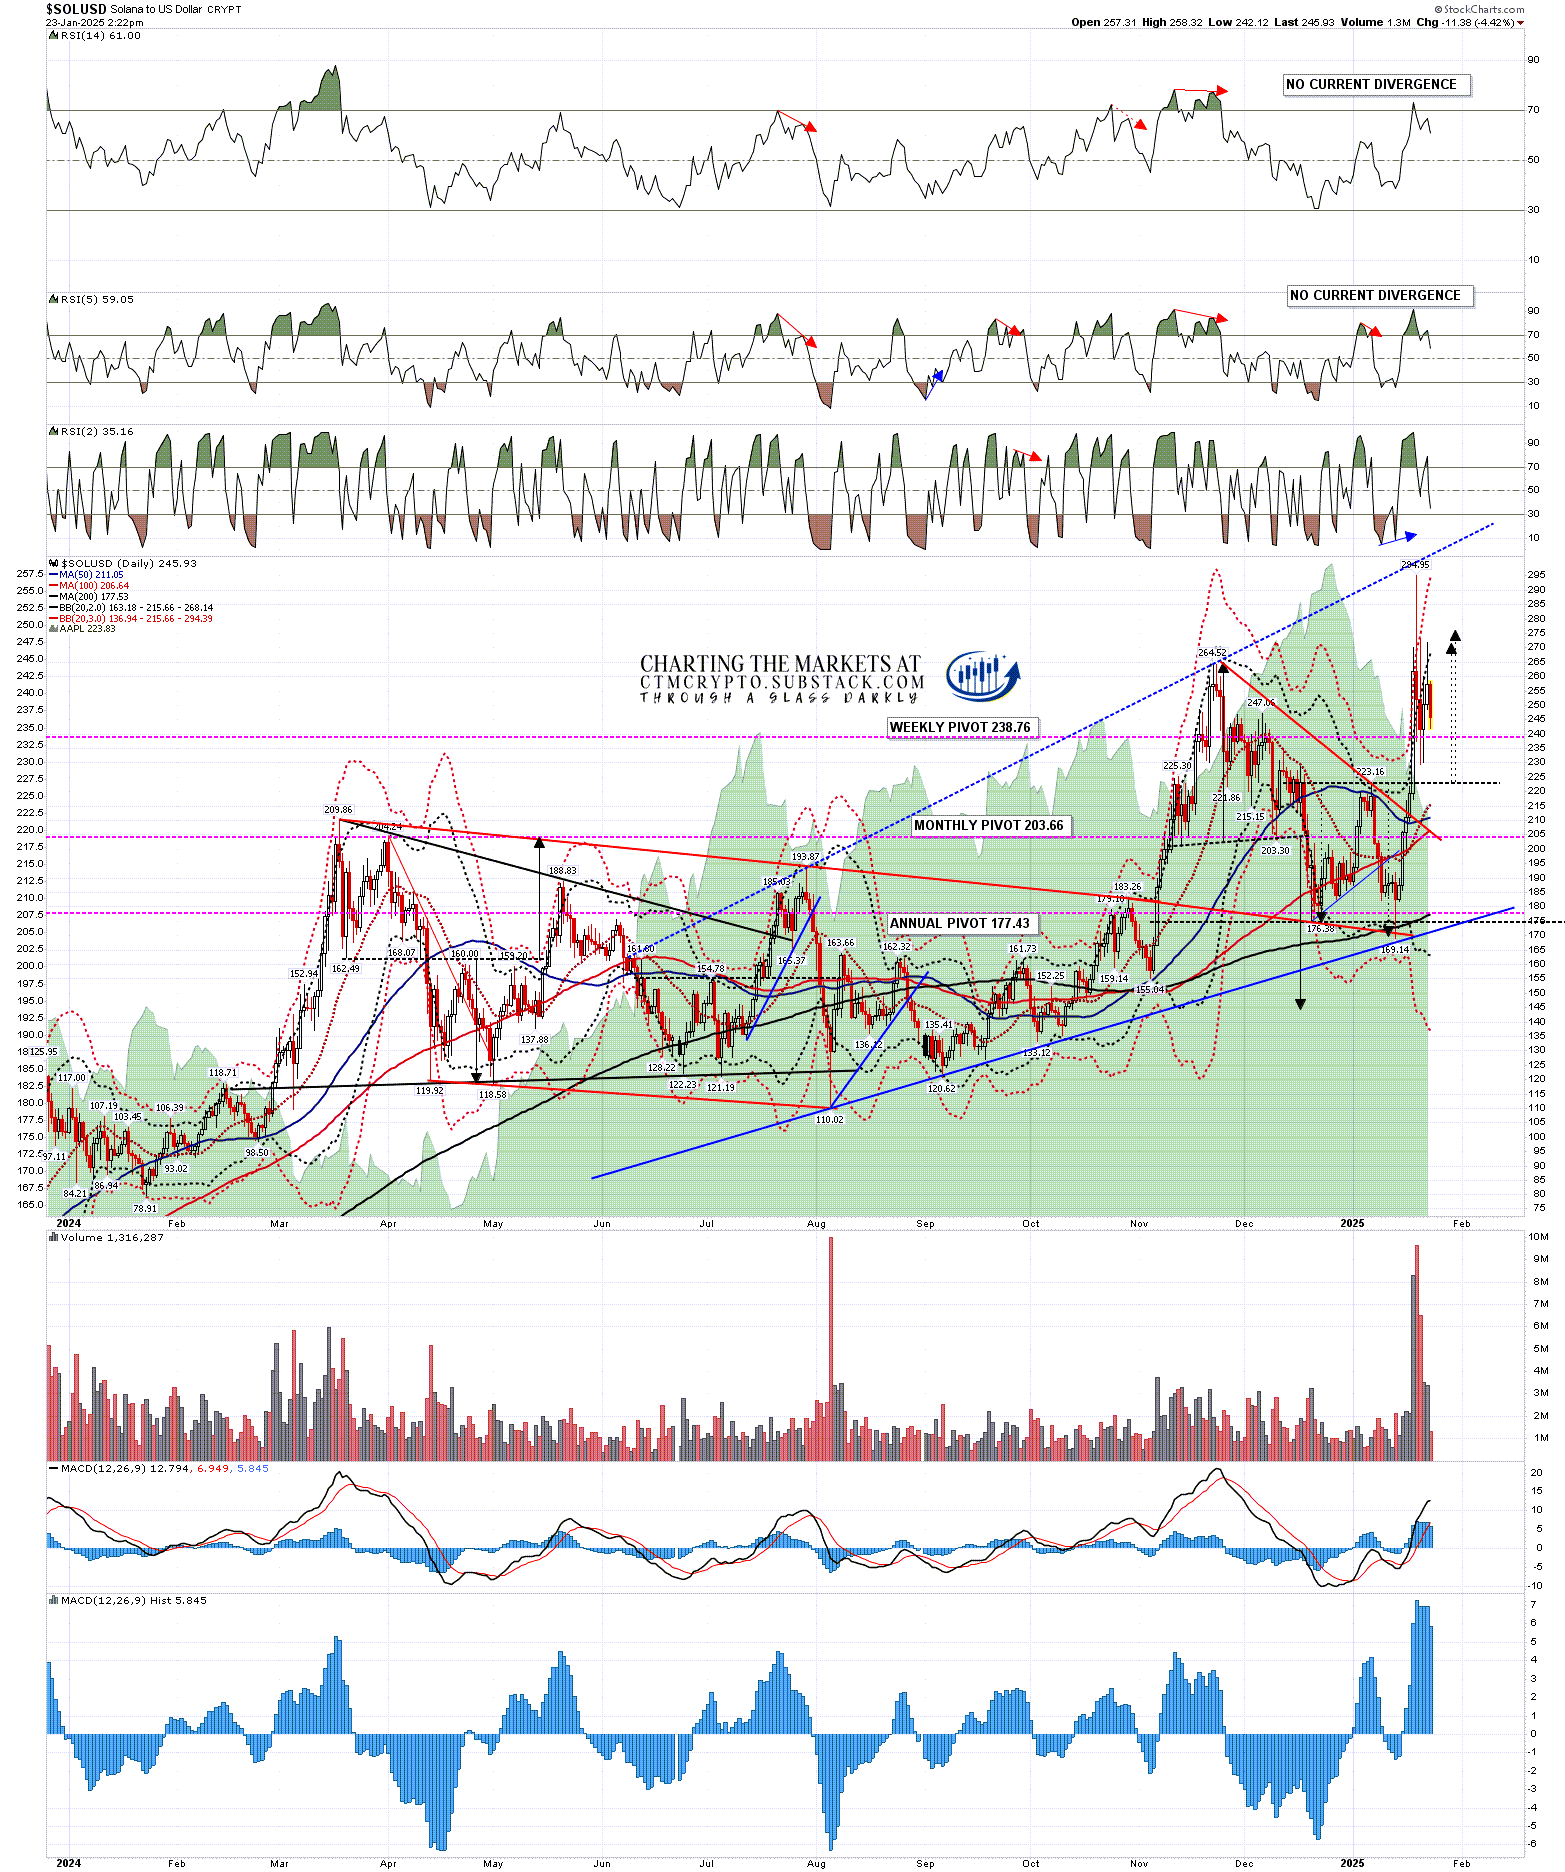
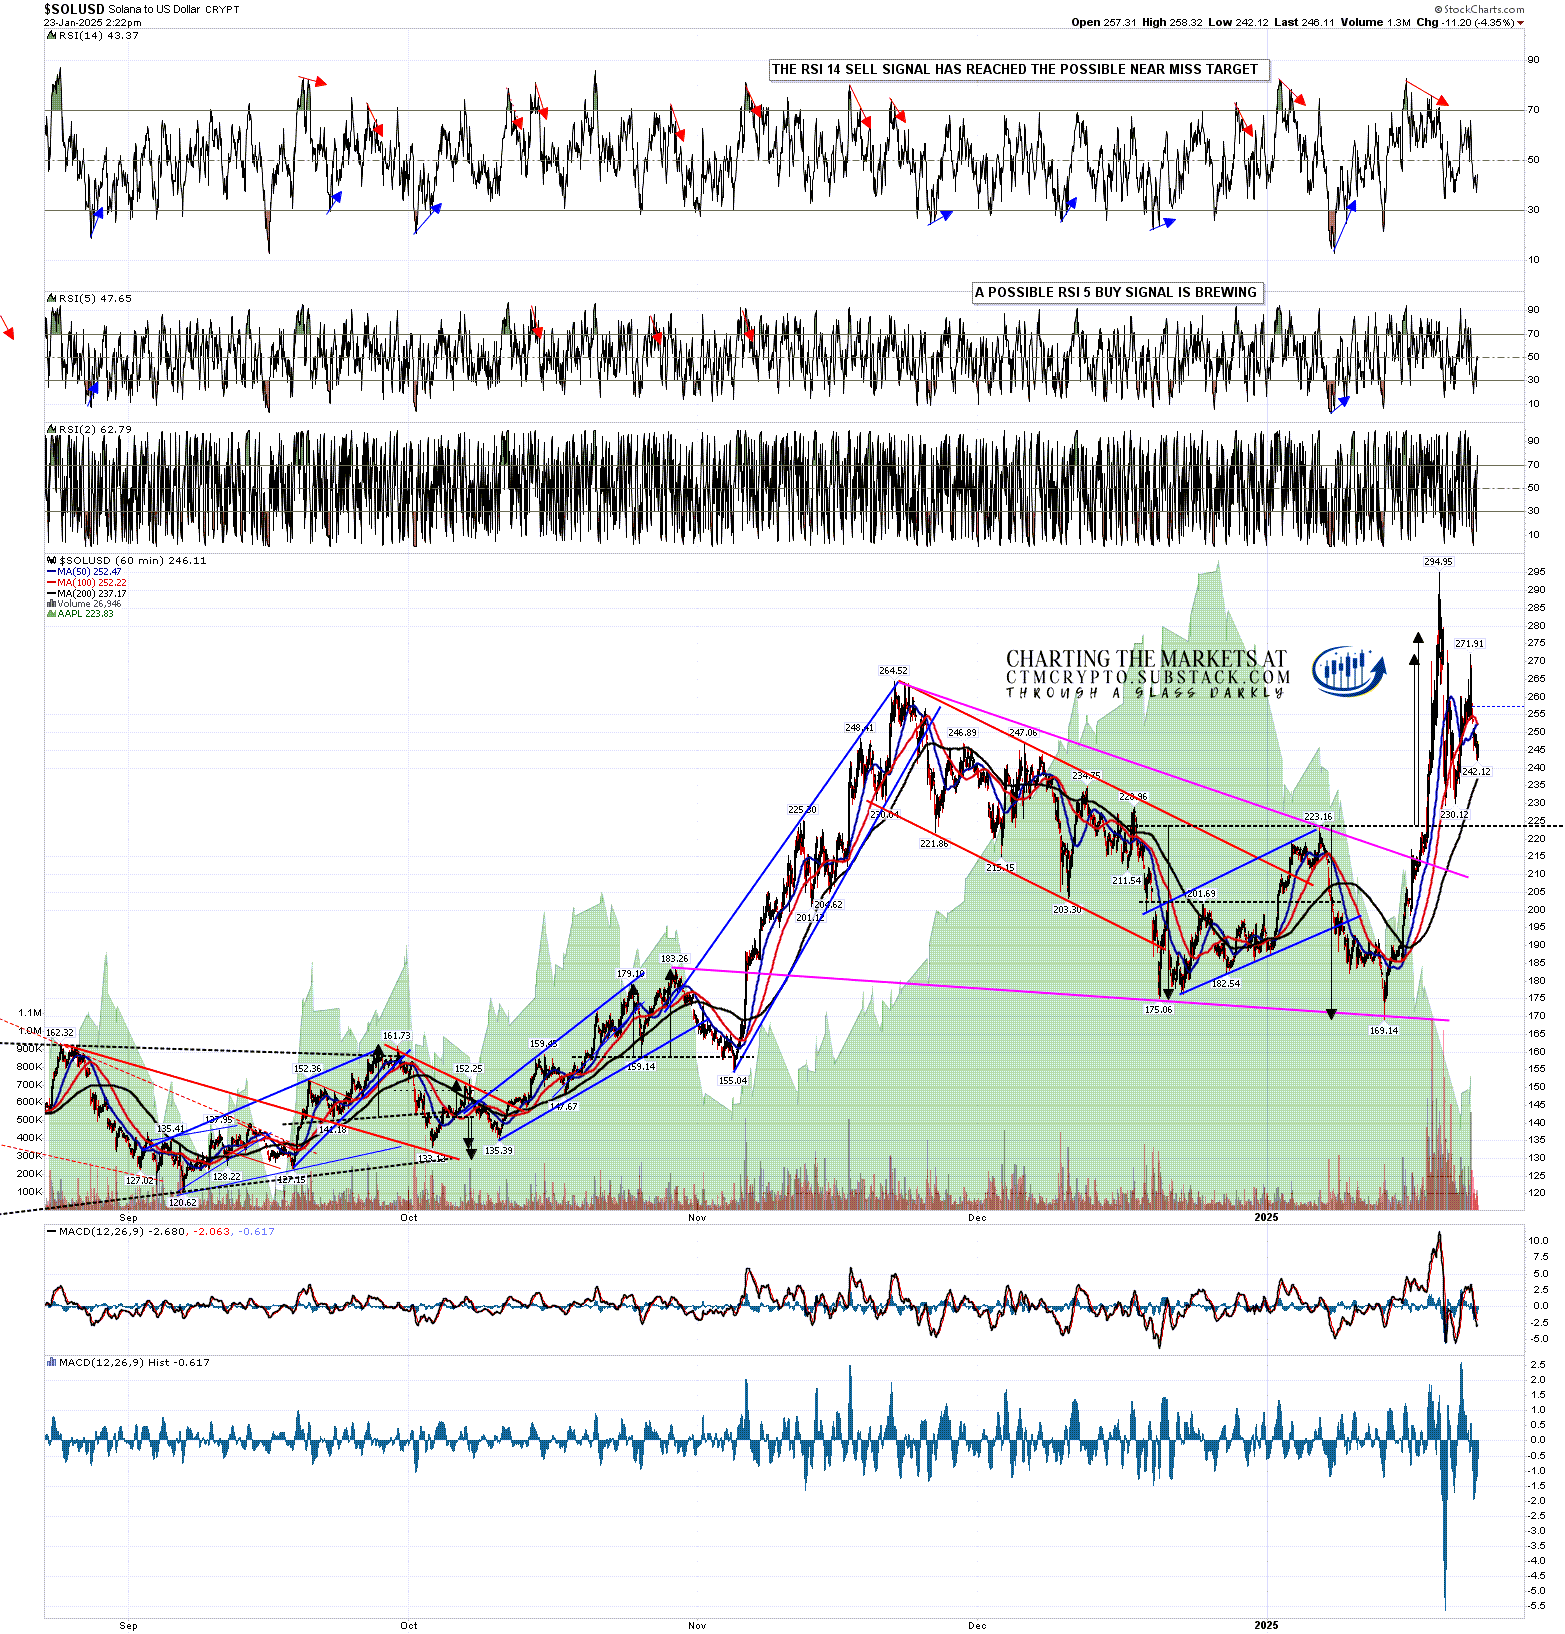
Solana (SOLUSD) also reached the target at the retest of the all time high, then made the extended double bottom target at 279, and finally topped out at a new all time high 10% above the old one at 294.95. Again it has since been consolidating and I am also wondering about a possible ATH retest coming and perhaps then a test of the obvious trendline resistance on the chart below that is currently in the 300 area.
The first thing that was really interesting about the wild move to new highs last weekend though was actually about Trump’s new memecoin, as that is on the Solana blockchain and triggered a very large amount of transaction volume that Solana handled without any issues. I’ve mentioned before that transactions are easier, faster and cheaper on Solana than Ethereum (ETHUSD), and that raises questions about the popularity of Ethereum. More about that further down.
SOLUSD daily chart:
On the hourly chart Solana appears to be forming either a triangle or a bull flag. Either would likely deliver a retest of the high in due course. If so I would note that retest would currently set both possible daily RSI 14 and RSI 5 sell signals brewing.
SOLUSD 60min chart:
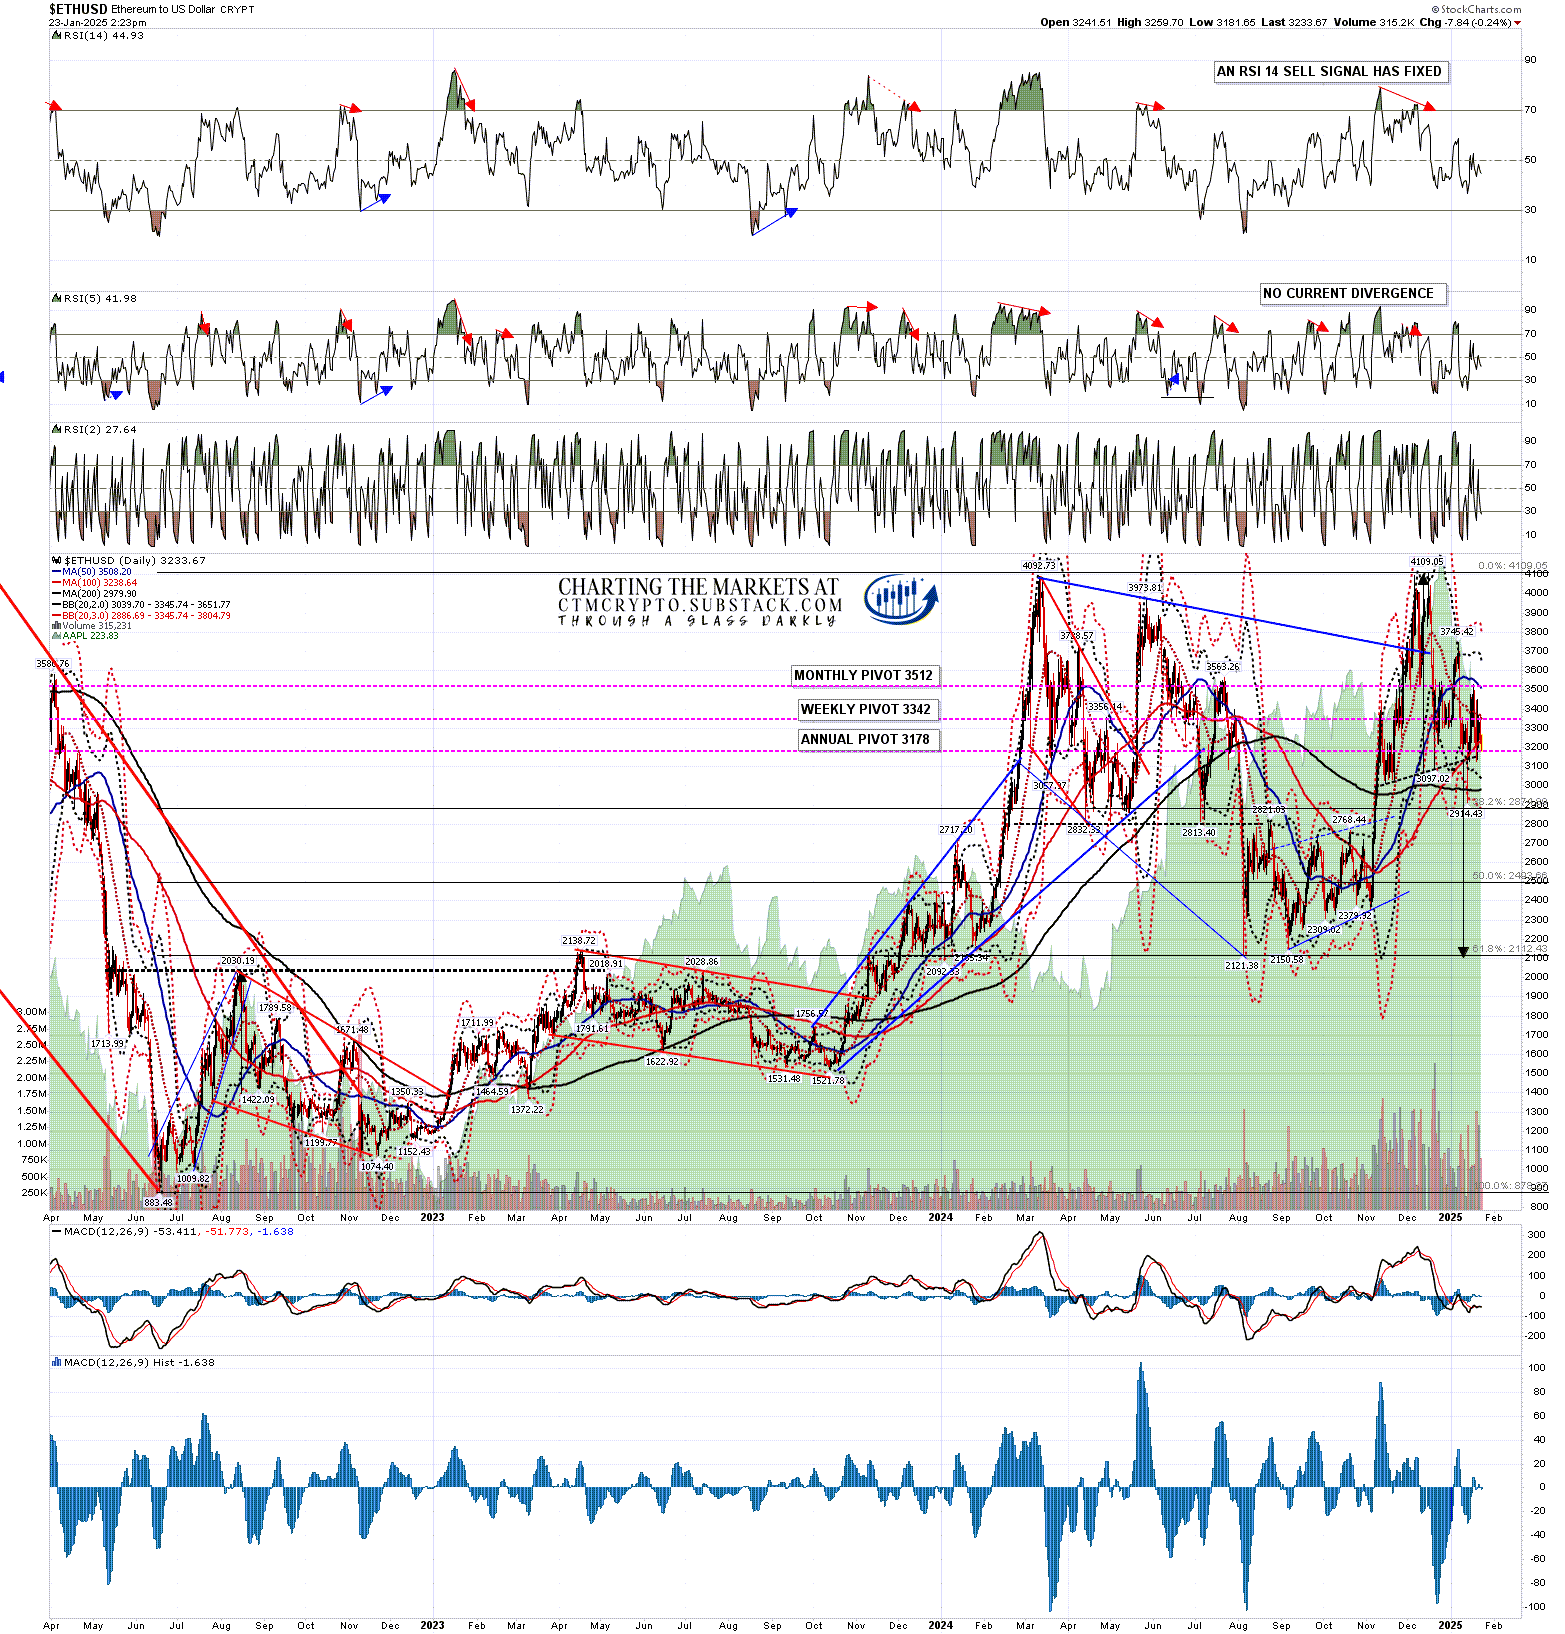
The second thing that was really interesting about the wild move to new highs last weekend though was Ethereum, which did relatively almost nothing, and at the time of writing has failed even to break back over the daily middle band.
A break over the right shoulder high at 3745.42 would invalidate the H&S and fix a target at the retest of the 2024 high at 4109.05, but Ethereum is currently a long way from managing that.
That’s an issue, as there is a decent H&S on Ethereum that formed and broke down with a target in the 2100, and that H&S has not come anywhere near being invalidated.
I’ve had a careful look at the Bitcoin chart versus Ethereum and Solana over the last few years and there have been no real sign to date of a Ethereum losing much ground to either, though it is so far the only one of the three to not make a new all time high in this bull market. That could be starting to change and I’ll be keeping an eye on that.
ETHUSD daily chart:
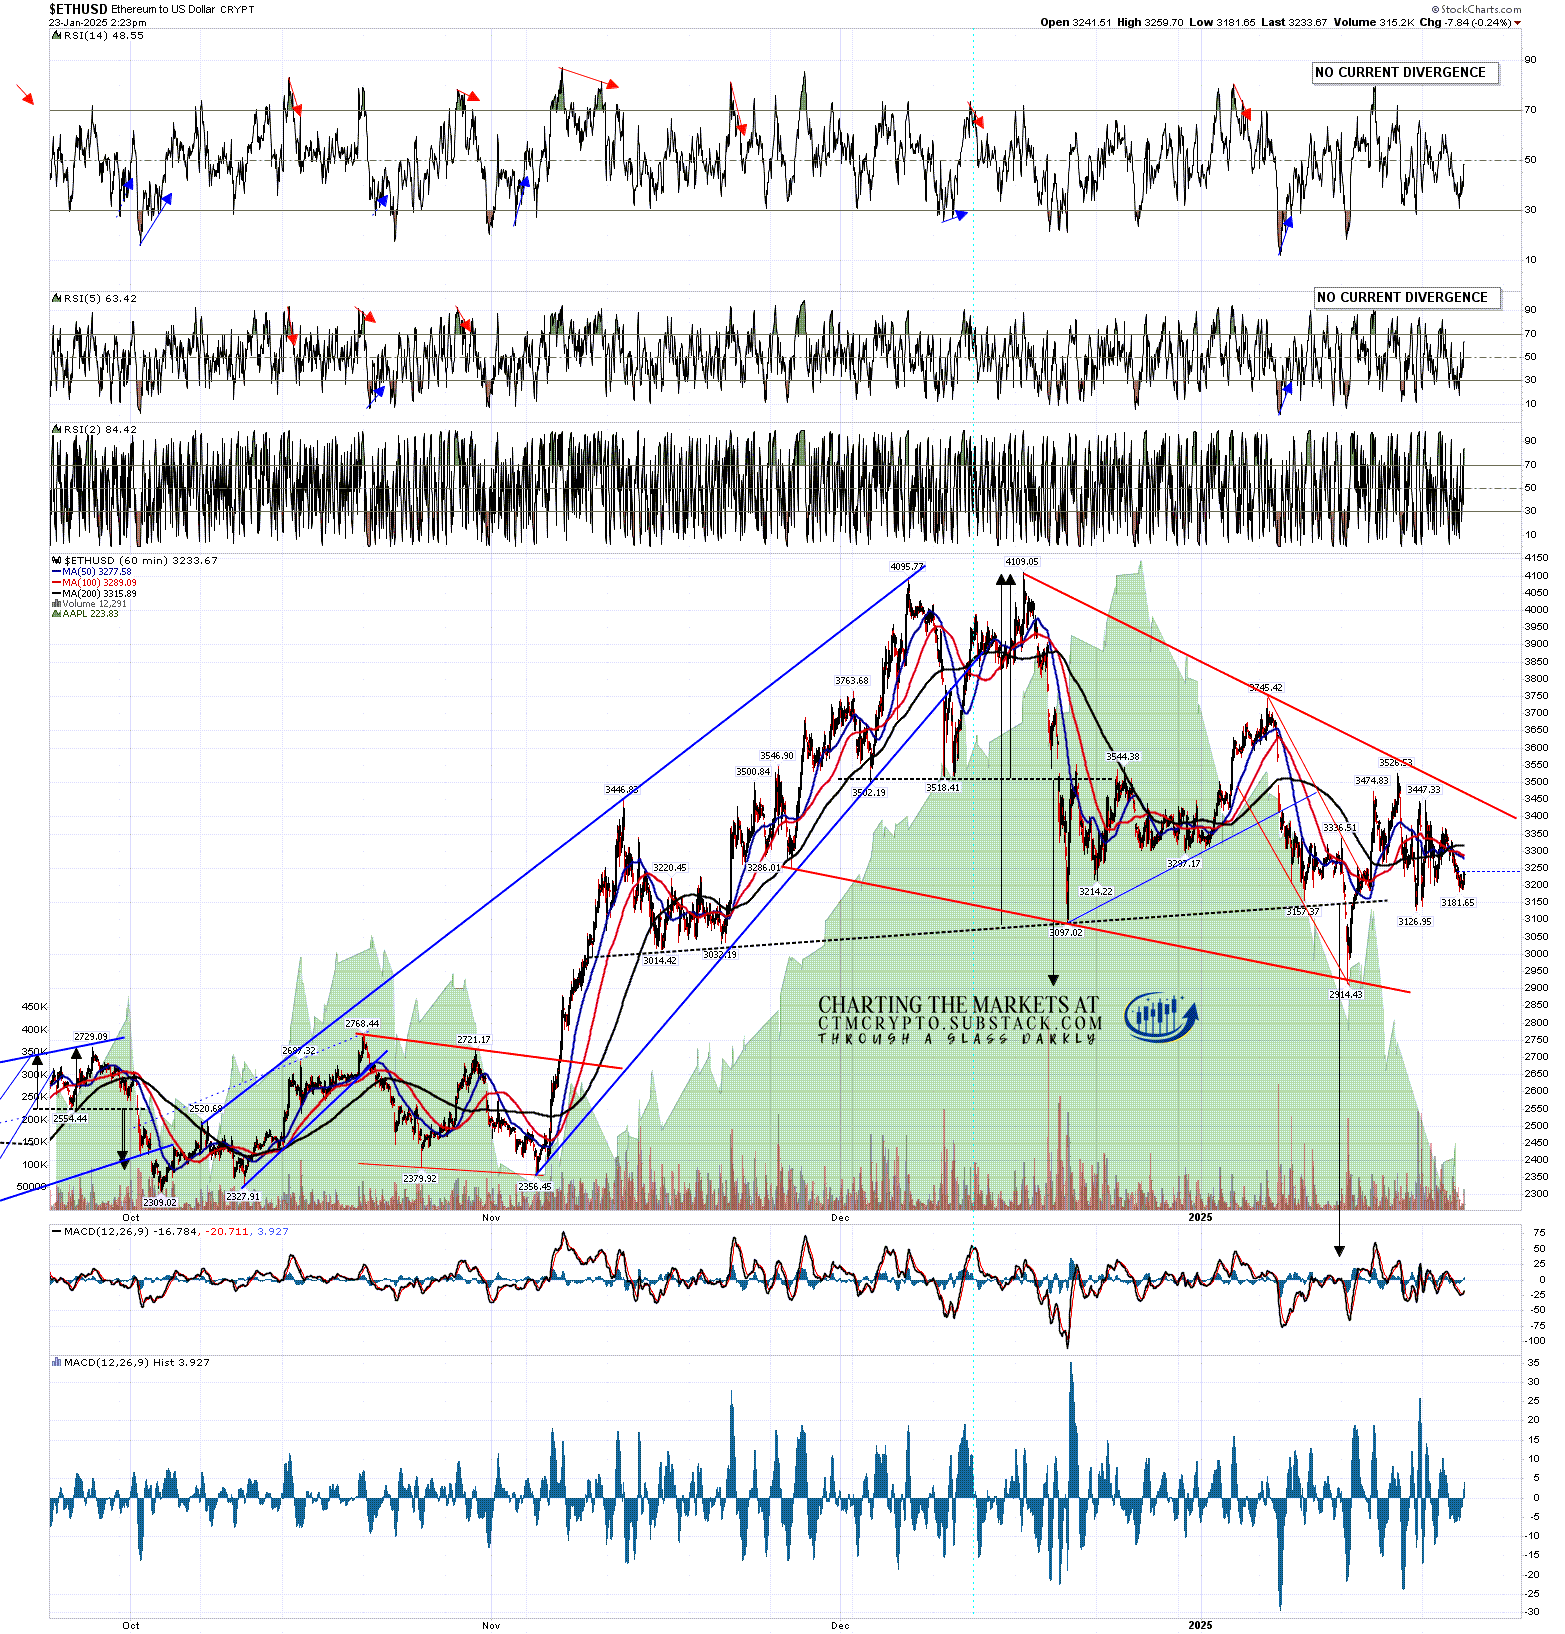
On the hourly chart Ethereum may be bullishly consolidating here and there is a clear path higher, even if Ethereum has so far seemed uninterested in taking it.
There remains a decent quality possible bull flag setup on Ethereum and a break over flag resistance, currently in the 3450 area, would again fix a target at the retest of the 2024 high at 4109.05. A further break over the H&S right shoulder high at 3745.42 would invalidate the H&S and fix a second target at the retest of the 2024 high.
ETHUSD 60min chart: