
Compared to the past three weeks, today feels like a crashing bore. Well, “crashing” probably isn’t the right word for a market that has been going straight up since the opening bell, predicated on the fact that Trump is supposed to………speak! So, I’m sure we’re all quite excited to hear more truthiness.
In the meanwhile, I wanted to share some charts of XME, the metals/mining ETF which I think has a very appealing risk/reward ratio as a short position.
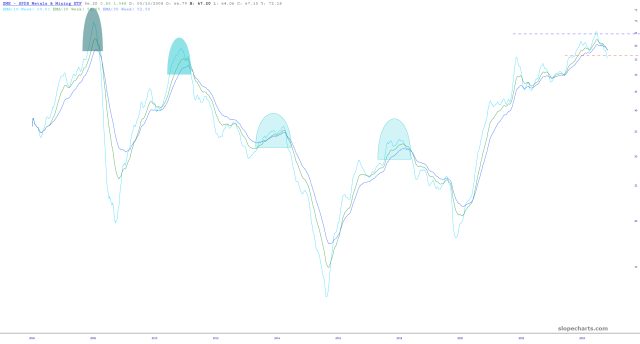
Here it is with the RSI, which is quite elevated:

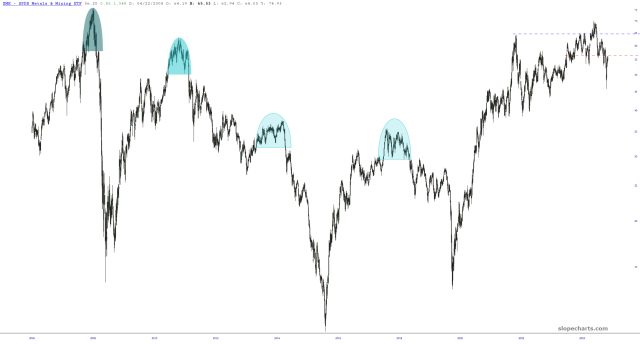
In this chart I’ve laid down the 50/100/200-day exponential moving averages but have hidden the prices so you can see the broad swings and cycles over many years.
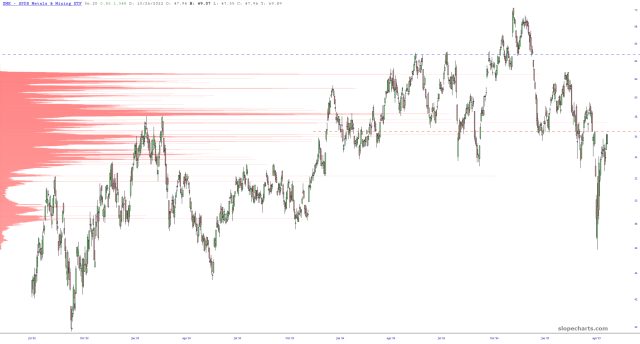
The volume profile illustrates the tremendous amount of overhead supply that exists above present price levels.
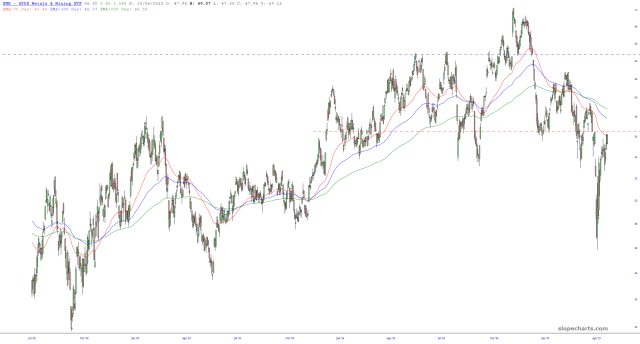
And, zooming in, but this time with price data, you can see how even the weekly moving averages portend lower prices ahead, as XME has only managed to clamor back to tag its lowest EMA.
All of which is to say I have cheerfully shorted XME in size with a very tight stop-loss at 56.60. Formerly, I had September $58 puts, but I am on a course to have pure short positions only, which means there are just two left (GLW and WEN) which I’ll sell whenever I think the time is right.
For the more curious among you, here are the top twenty holdings of XME, which is a mix of both precious and not-so-precious metals miners.

