
Hello everyone. In my last post I hinted at the fact that if GOOG could go higher, than the market could go higher. Indeed it went higher.
One thing I want to get quickly out of my chest is that I don’t think we are in a Bear Market (I may be wrong).
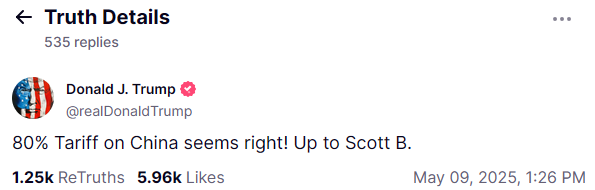
I think we had a crash after Trump announced its tariffs, and then, as it slowly became more and more clear than the tariffs are not really real, or at least they won’t be what they initially looked like (e.g. read the news today point at a 80% tariffs for China, not 145%, the US President said), well, I think a lot of investors started to correct the initial panic, algos started to buy, and the “Bear Market” is formally over. Can it come back again? Yes, of course, but I see more “quick shocks” rather than prolonged downtrends.
Anyway, all this said, and I repeat, I may be wrong, and a recession could come and hit stocks, etc., I want to focus on the short-term TACTICAL positioning, this time using the SPX index as a tool to determine the broad market direction.
Here below you can see the chart with the support and resistance levels, with associated probability of reversal, for the SPX WEEKLY model:
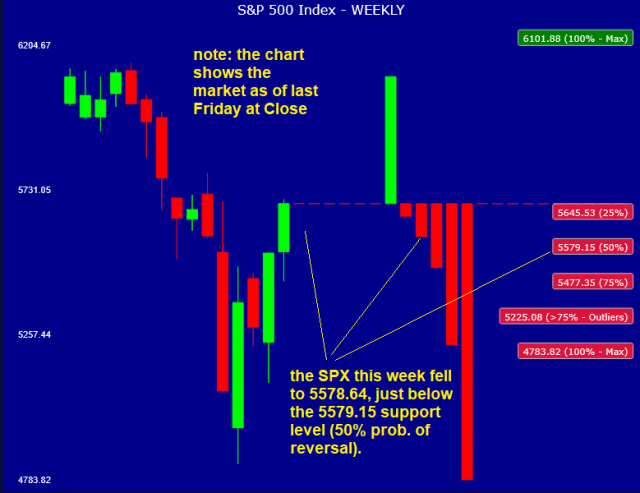
Please note the chart does not show yet what happened this week, this is updated on Saturdays, it represents a photograph of the market last Friday, at the WEEKLY Close.
IMPORTANT: you do not need to wait for the WEEKLY Close, this Friday, to take action, if the market is going down, the support levels you see on the chart are valid now and will not change at the Friday’s close (if the close is down – but if the close was up, then they would change, they will be recalculated but you do not immediately need the levels, unless you want to target an option Strike Price for a WEEKLY call, in that case you need to wait for the Saturday update and place the trade on Sunday with Futures or Monday overnight with the SPX index options when they start trading).
The main comment I want to make about the chart above is that the SPX touched briefly the 5579 level (50% probability of reversal) during the week, then rebounded. If the index closes down, this could be a buy-the-dip opportunity, but I would be happier if I could see the market going down a bit more, another week:
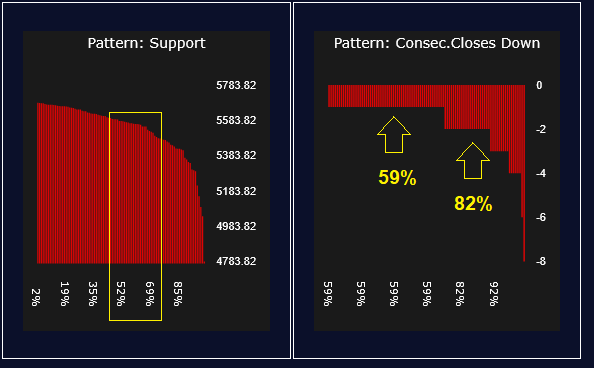
The LONG model above shows how the market behaved in history, since 1980, every time this trend pattern was encountered. A trend pattern is a certain market behavior identified by my algorithms using a number of mathematical formulas.
The left graph (Pattern. Support) shows that the area between 5579 and 5477 has between 50% and 69% probability of reversal. 5579 was already touched this week, if the market could go down a bit more next week, it would be possibly a good LONG trade set up.
The right graph (Pattern: Consec. Closes Down) shows the trend pattern behavior in time, or more simply: how many consecutive weeks the market fell when this pattern was encountered in the past?
In most cases (82% of the times), it fell for 2 weeks, and then the third week was up (reversal). So, if we combine together the 2 weeks down, with a 50-60% probability of reversal on the price model (left hand side), we get nearly 70% probability of reversal, on average and this is a very good probability for a volatile market.
So, the conclusion is: the market could go up next week, but if it goes down a bit, it may be a good BUY opportunity.
If you had to place a PUT, the 5579 and 5477, would be the area to target for the Strike, 1-week expiry options.
ALTERNATIVE SCENARIO: the market closes this week up! in this case, all I said above does not apply, and you have to place a SHORT trade at the Close. The targets will be recalculated on Saturday, so I am unable to post them here timely.
The best instruments for this trade would be:
SHORT Futures or ETF
BearC ALL ATM (or at a Strike slightly below the close, to improve the skew in your favor).
