Apologies, in my previous post (today), I forgot to add a chart for Crude Oil LONG.
Since this scenario is panning out as I write (CL Futures Nymex expiry Aug2025 touched below 68 an hour ago), I think it may be helpful to briefly discuss where this pullback can go.
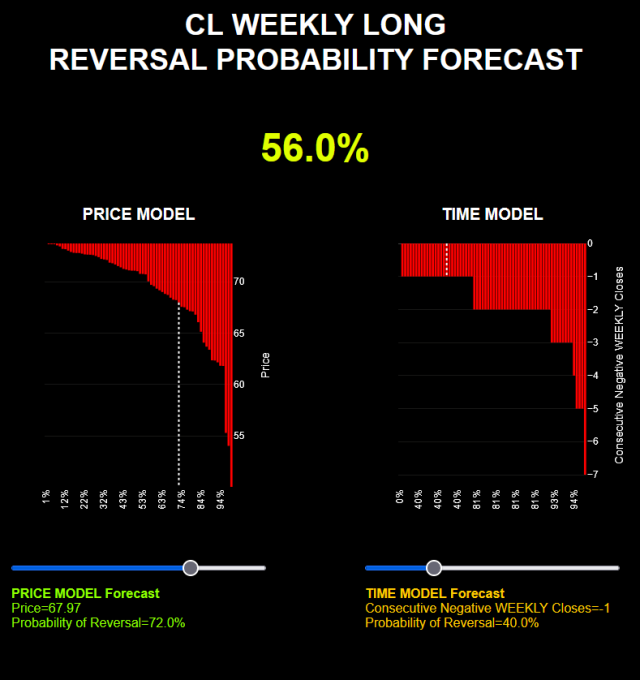
Here below is the LONG WEEKLY model for CL futures, front month (Aug25).
On the left side, the price model: you can see Crude Oil has already reached the WEEKLY OVERSOLD area! (totally contradicting what I said today, i.e. probably a small pullback).
Probability of reversal in the price support zone below 68 is around 72%, quite high.
Then, on the right we have the time model, it evaluates when the market turns after x amount of time down. In theory we should wait for the end of the week to use this because it is a WEEKLY model, however, 1 week down, even intra-week (e.g. today) does count as 1 week down, so at the moment we know that if Crude Oil closes this week down the prob. of reversal for 1 weeek down, according to the weekly model, is 40%, not much (but good enough for a buy-the-dip).
I’d be surprised if Crude Oil pull backs for 2 weeks, however the histogram on the right hand side (time model) is saying exactly that: 2 weeks down IS the most frequent outcome (you see how much larger is the -2 week down area on the histogram?).
So in conclusion:
price model OVERSOLD
time model NOT OVERSOLD (could go down 2 weeks).
Since the price model is oversold I would not give too much importance to the time model in this case, but anyway I hope I have clarified my view, if you have any questions, let me know!