
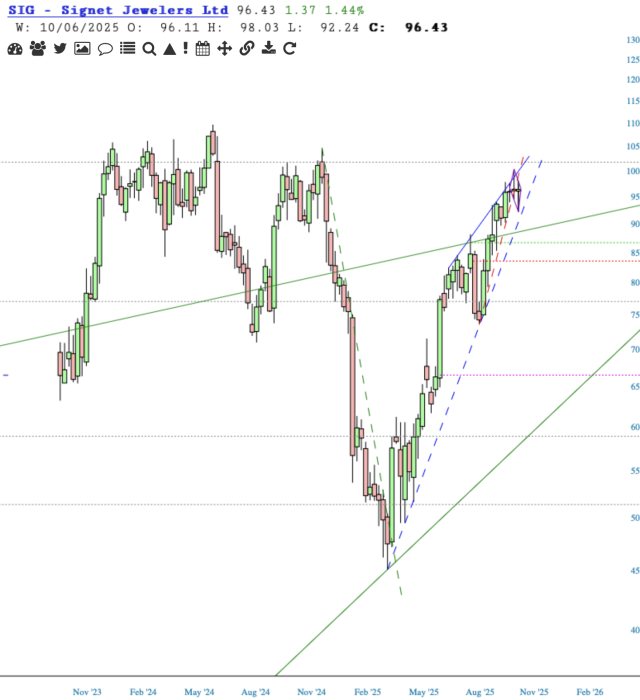
Signet Jewelers’s [SIG] V-recovery was most impressive, altho it missed the high-water mark. On this weekly chart, price is now in a bearish rising wedge. Falling down out of the wedge is the shorting trigger. Negating this shorting op is if price breaches resistance of the dashed red and solid blue line.
Looking at the red dashed line on the daily chart, price has already broken below the wedge, the red line defining a tighter version of the larger wedge in blue. And, price has backtested the underside of the red dashed line (former support, now resistance). This is not to say price won’t again test upside resistance; it well may, as very near term, the chart is bullish.
The purple diamond was an, “Oops, there it is!”, so I drew it. It’s an additional piece of price action info.
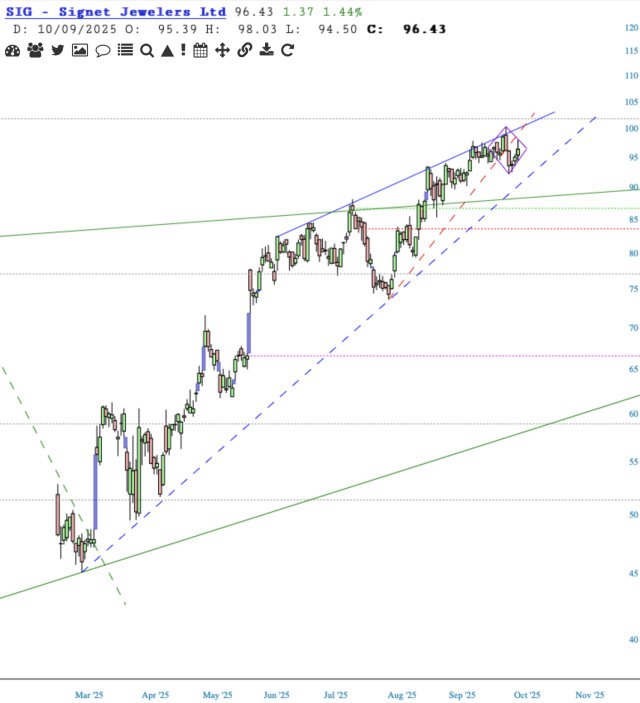
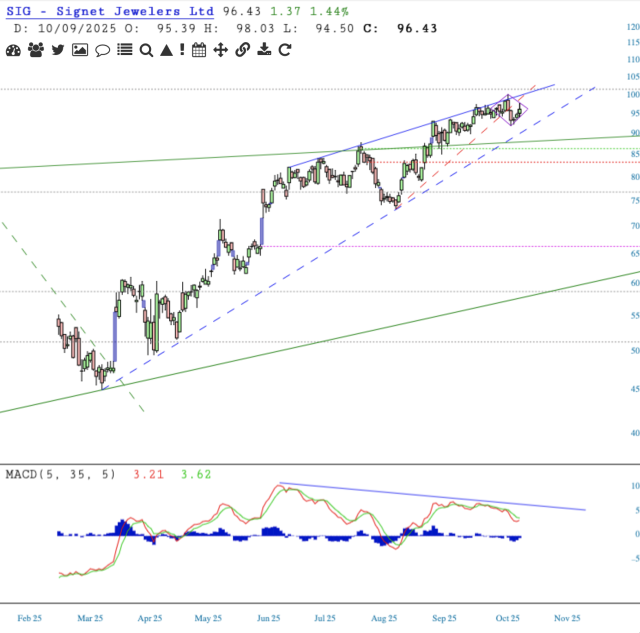
Worthy of note is the negative divergence that has been in play since the gap up on 3Jun25. That gap is at $66.89 (fuchsia).
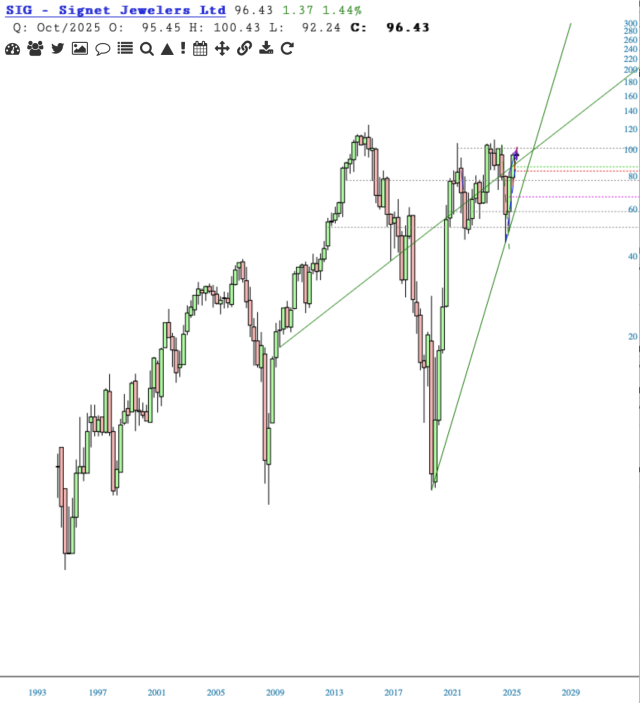
Perspective using the quarterly chart.
Happy Charting!
