When I began this post, I already knew it had been an amazing week but having taken the time to scrutinize the index charts more closely, I am more impressed than ever at the clarity of what is happening. The tops are clean, complete, and suggest tremendous downside potential for the balance of 2026.
Starting with the NASDAQ Composite, you can see the sensational top as well as the very clean price break between Thursday and Friday which has set up the most proximal level of resistance.

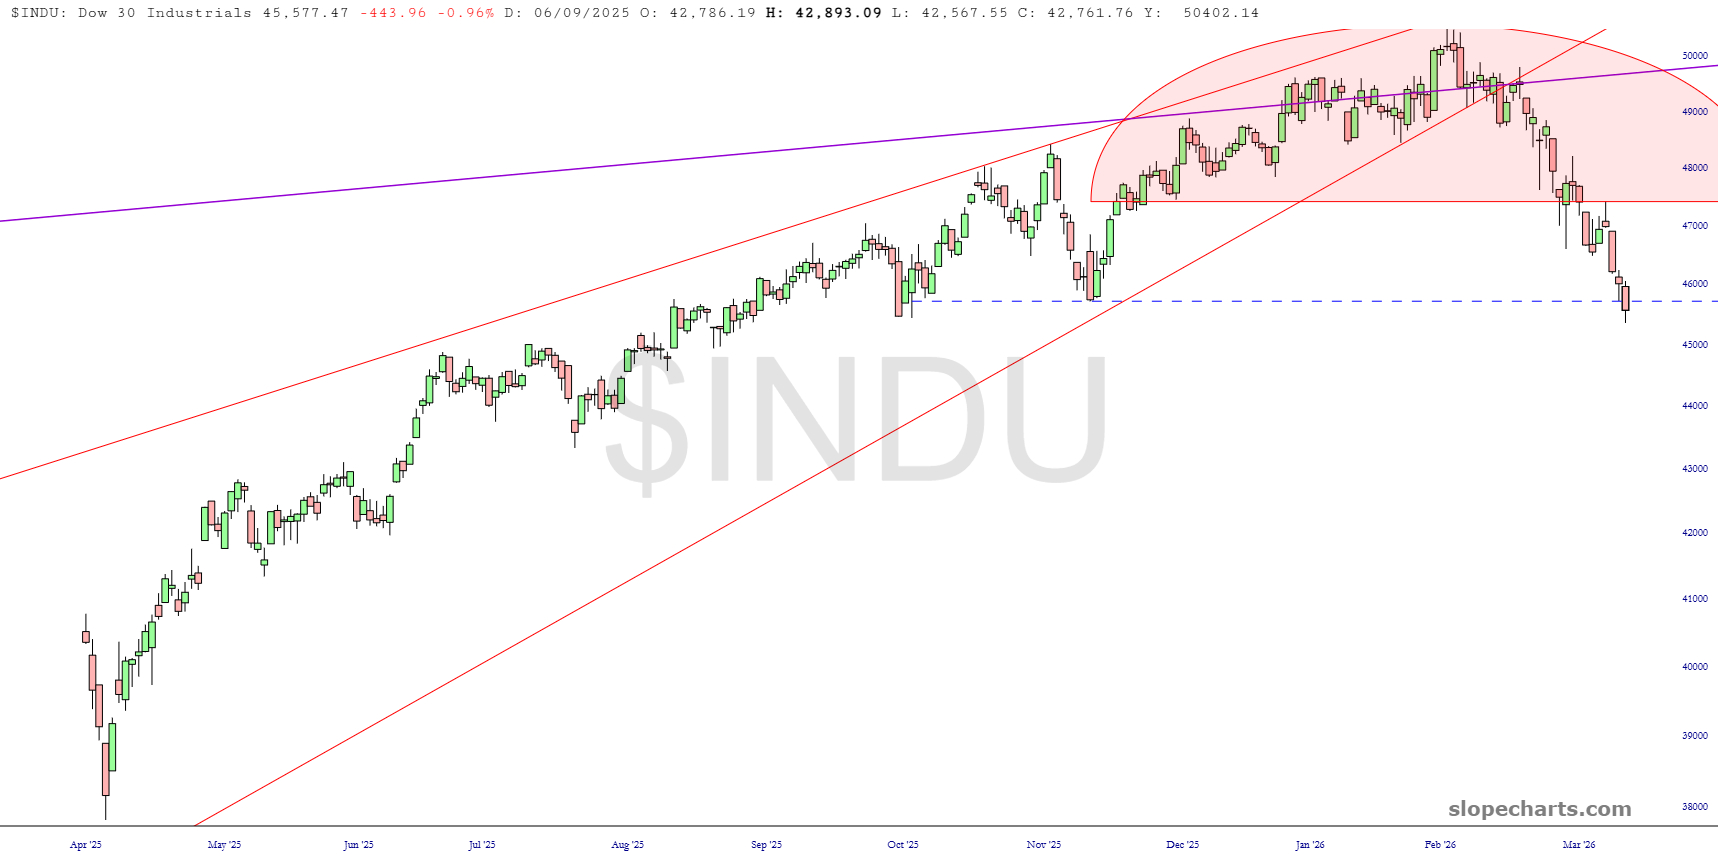
The Dow 30 is tougher to read, partly because its slump has been so steady and persistent. Over a span of just weeks, thousands of points have been shed, and we’ve even cut below the low experience in November of last year
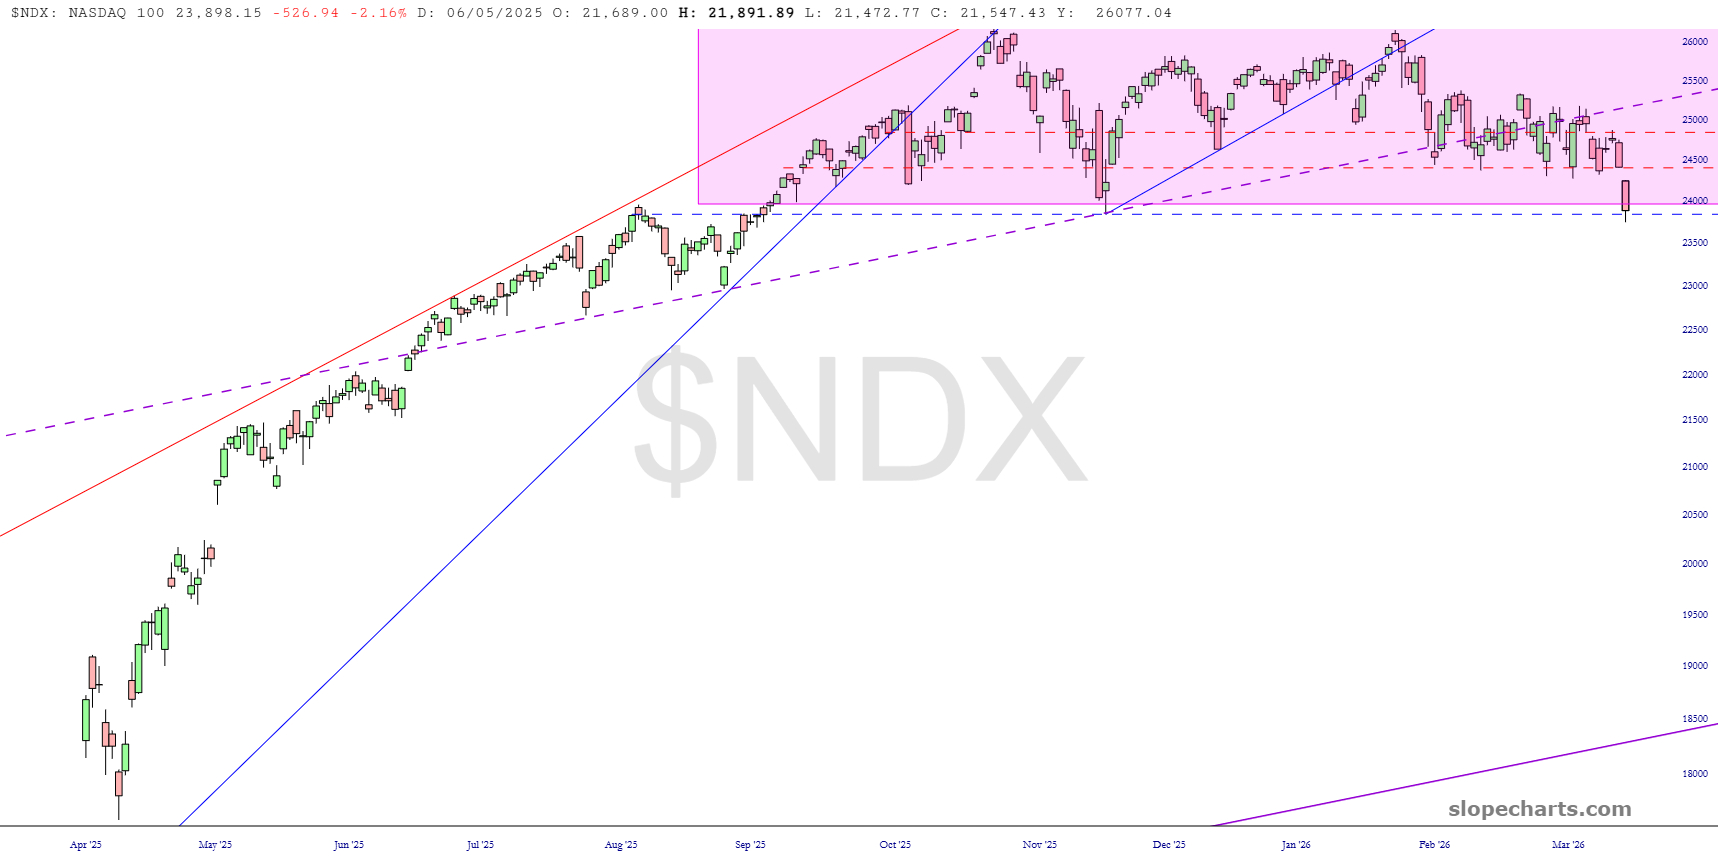
The NASDAQ 100, however, sports the same clarity as the broader Composite. Here you can likewise see the exceptional top spanning back over half a year as well as the price gap which defines resistance.
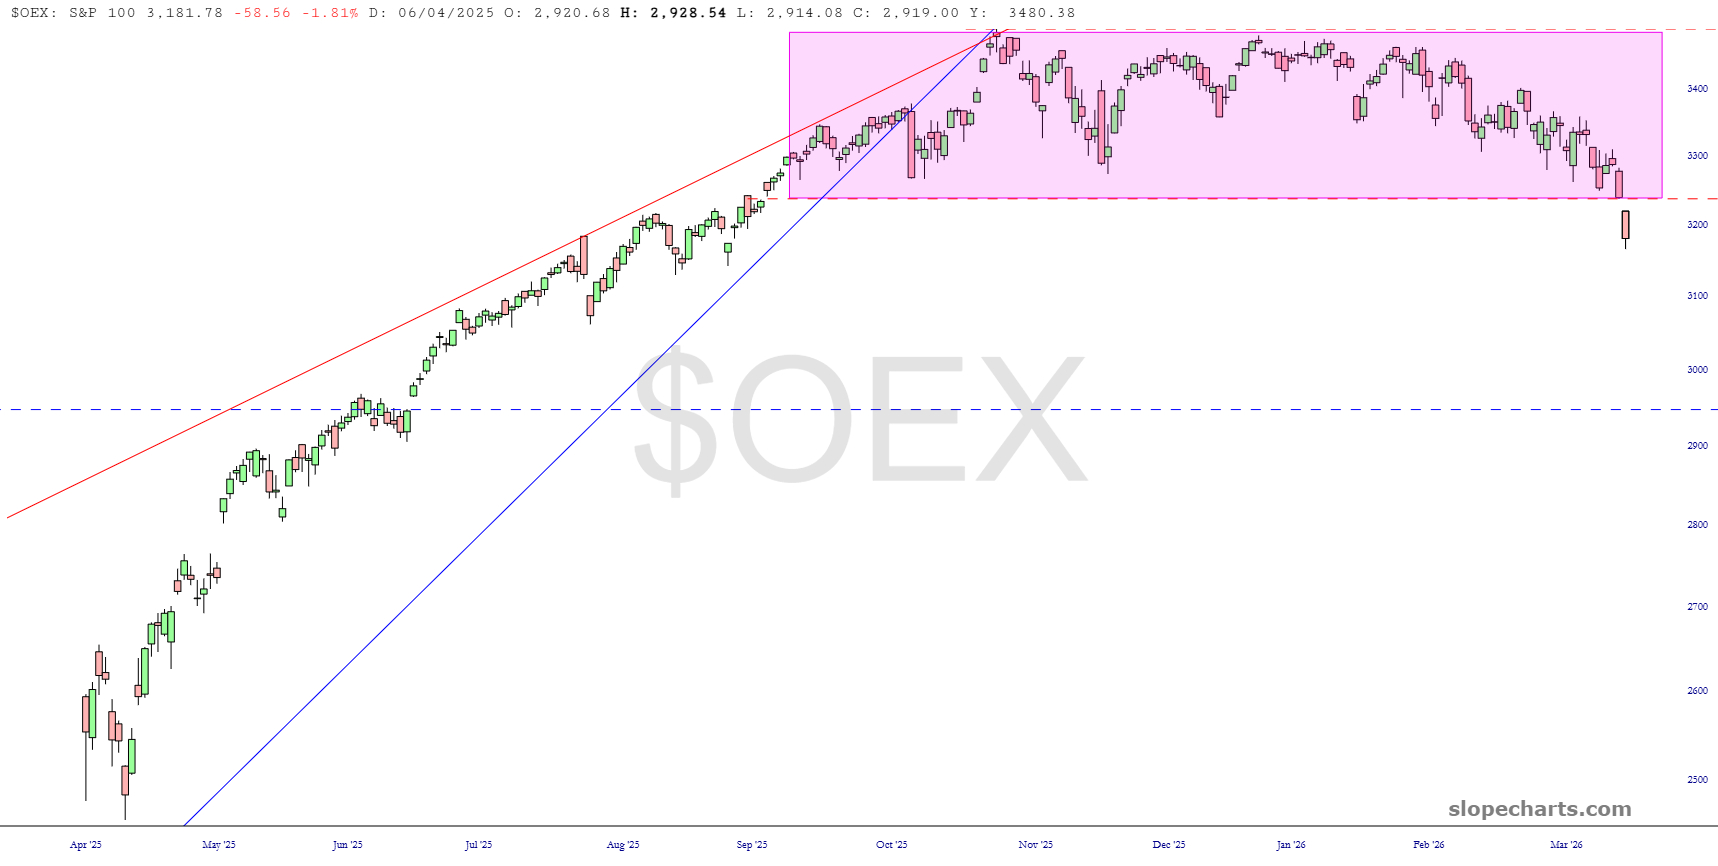
The S&P 100 has a medium-term target shown by way of that horizontal line, and as with any of these other examples, a modest countertrend rally is perfectly acceptable, although it would best if it did not exceed its Thursday/Friday price gap.
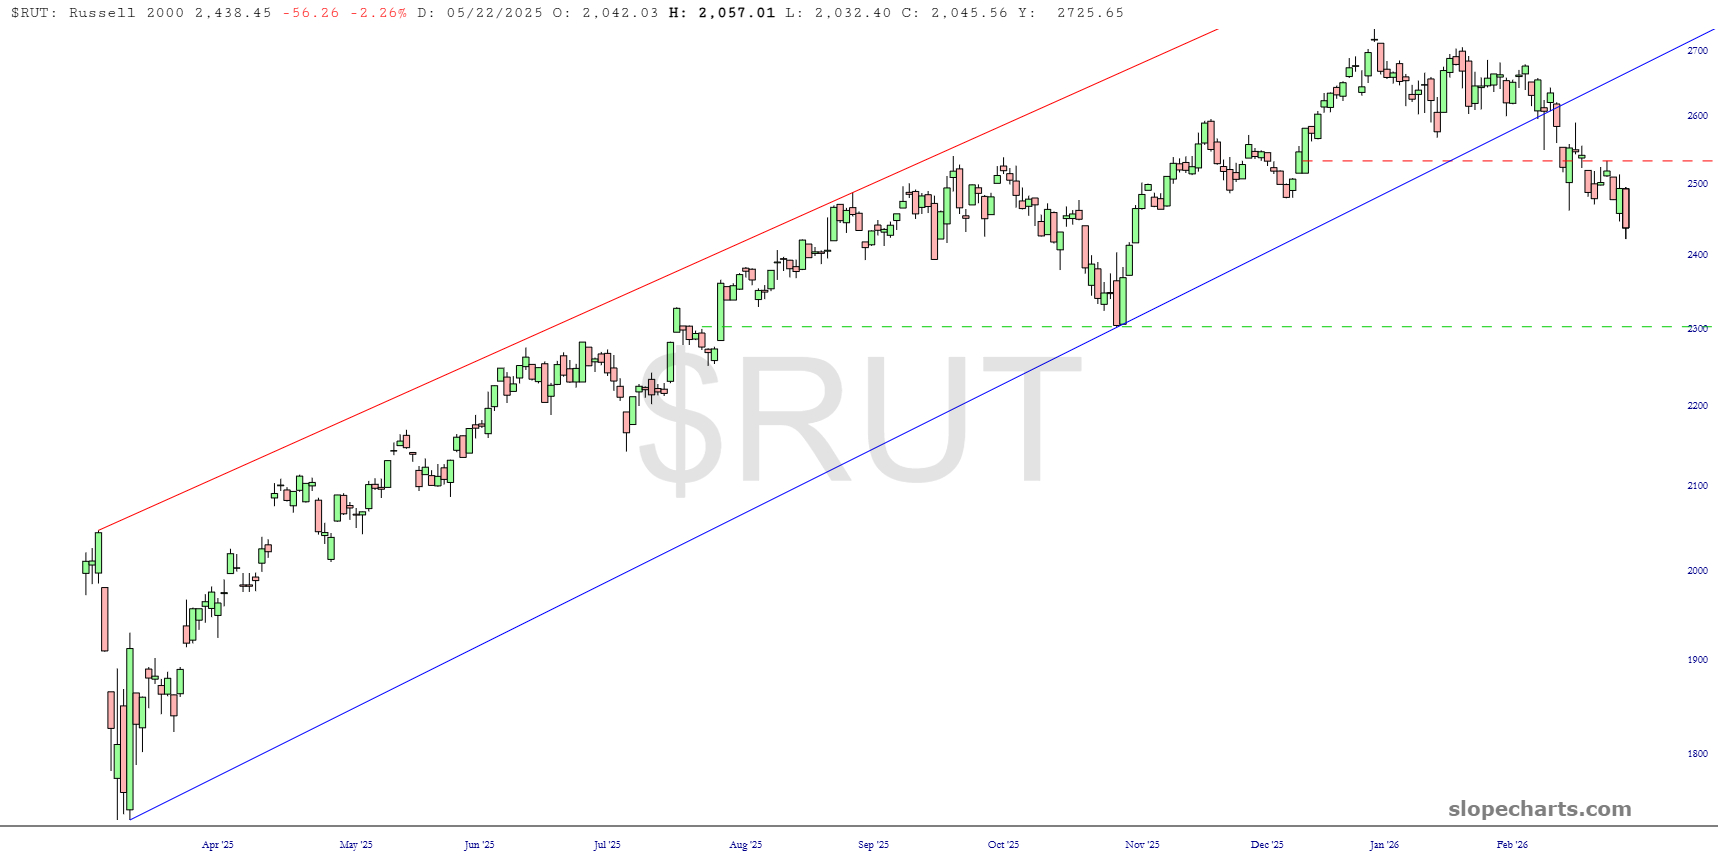
I have also provided a medium-term target for the Russell 2000 by way of the dashed horizontal. Once the small caps had broken beneath its ascending price channel, it was in serious trouble.
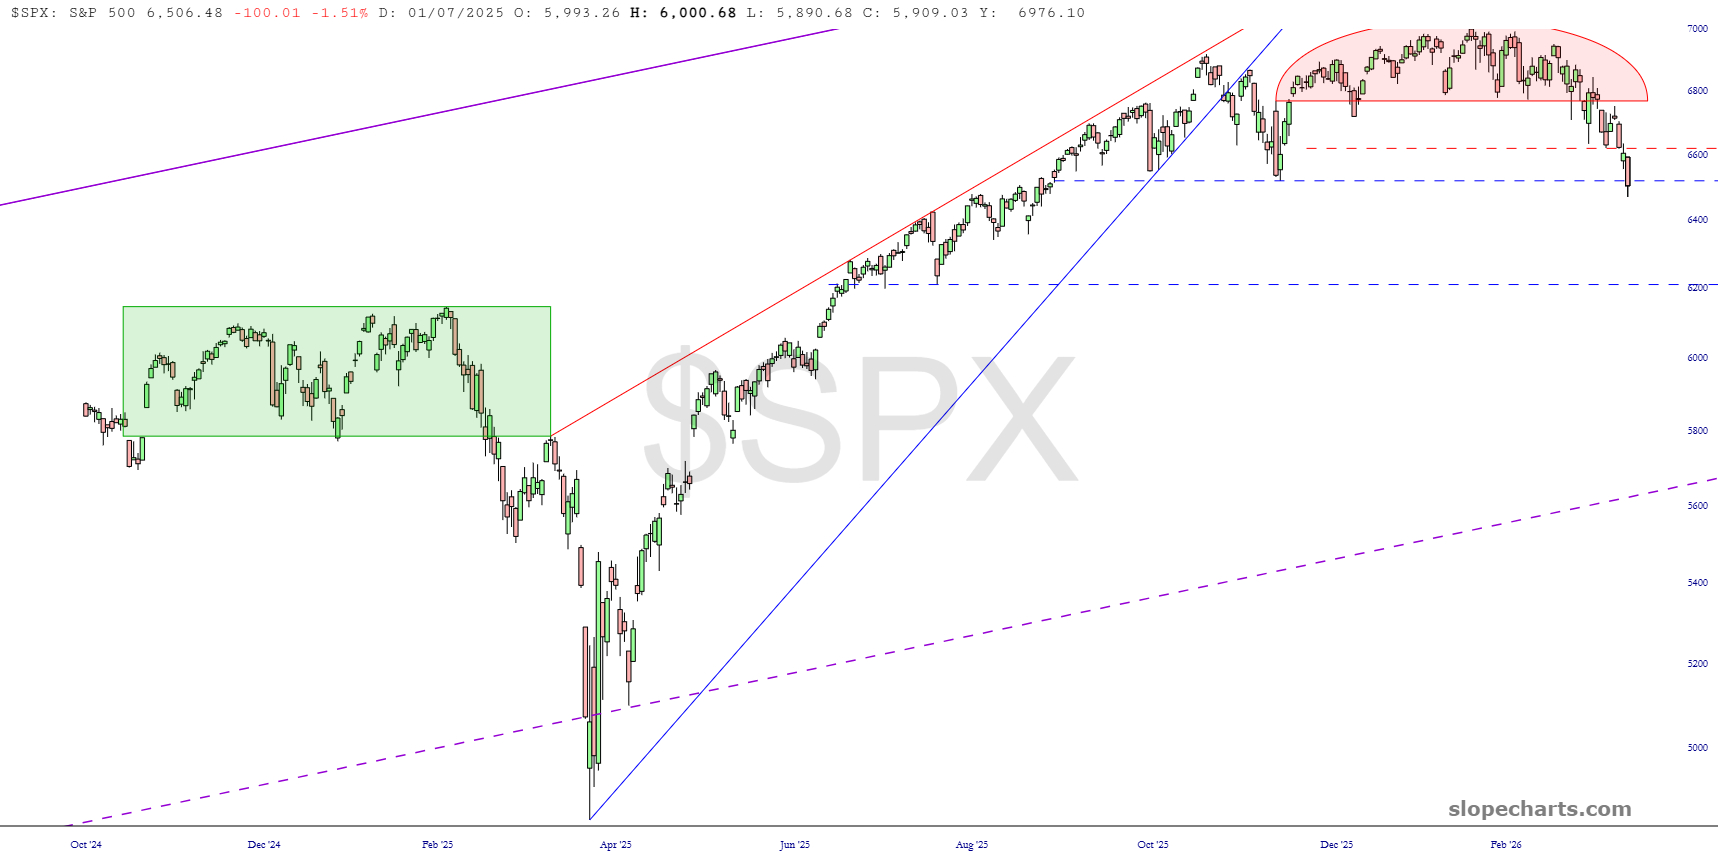
The exceptionally important S&P 500 presents to us the cleanest reversal pattern of the past eighteen years. A drop to almost 6100 in the medium-term seems highly probably, with much stronger bearish potential beneath that.
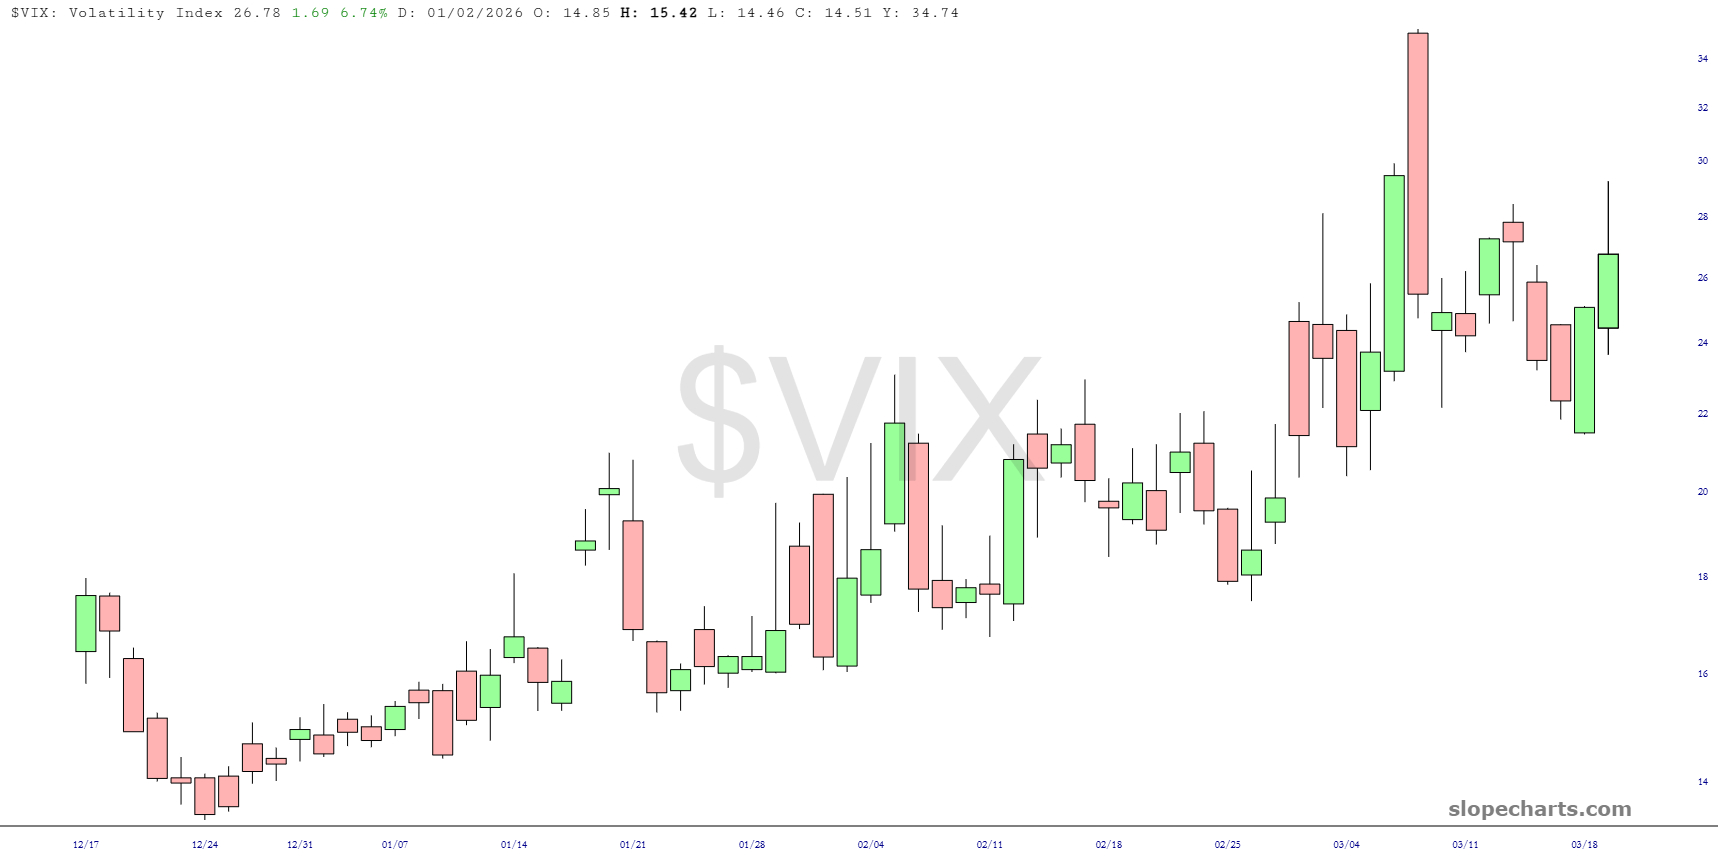
Finally, volatility is nowhere near panic levels. Yes, it’s nice to be in the 20s again, but there hasn’t been anything even close to a washout. Wake me up when we’re over 50!