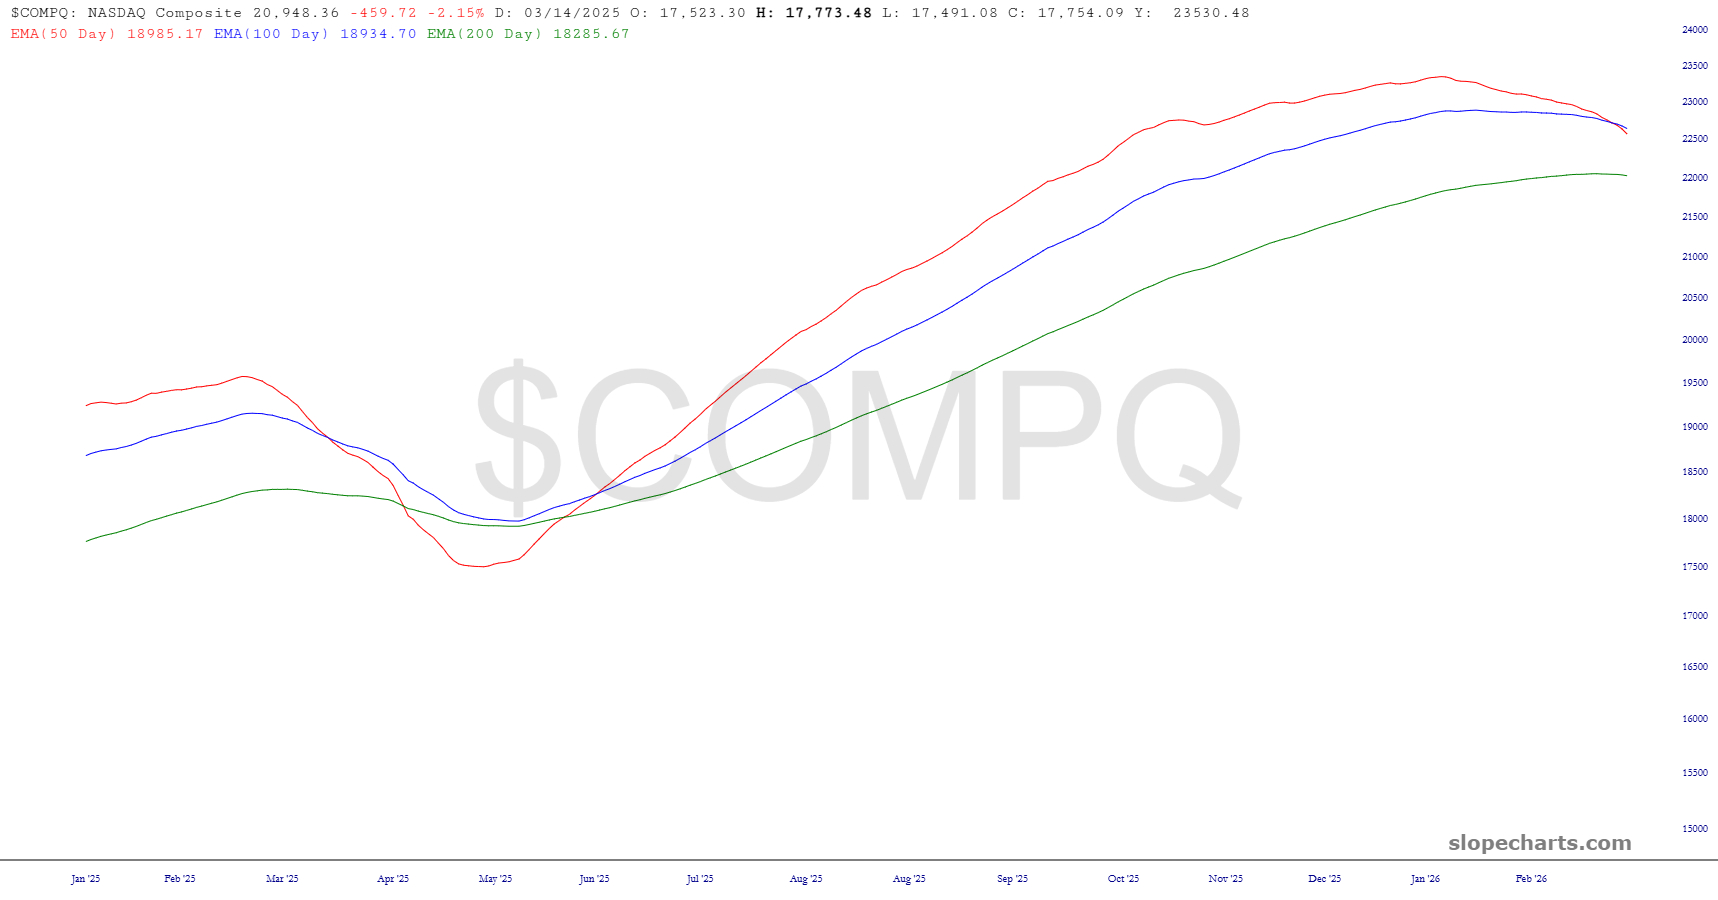
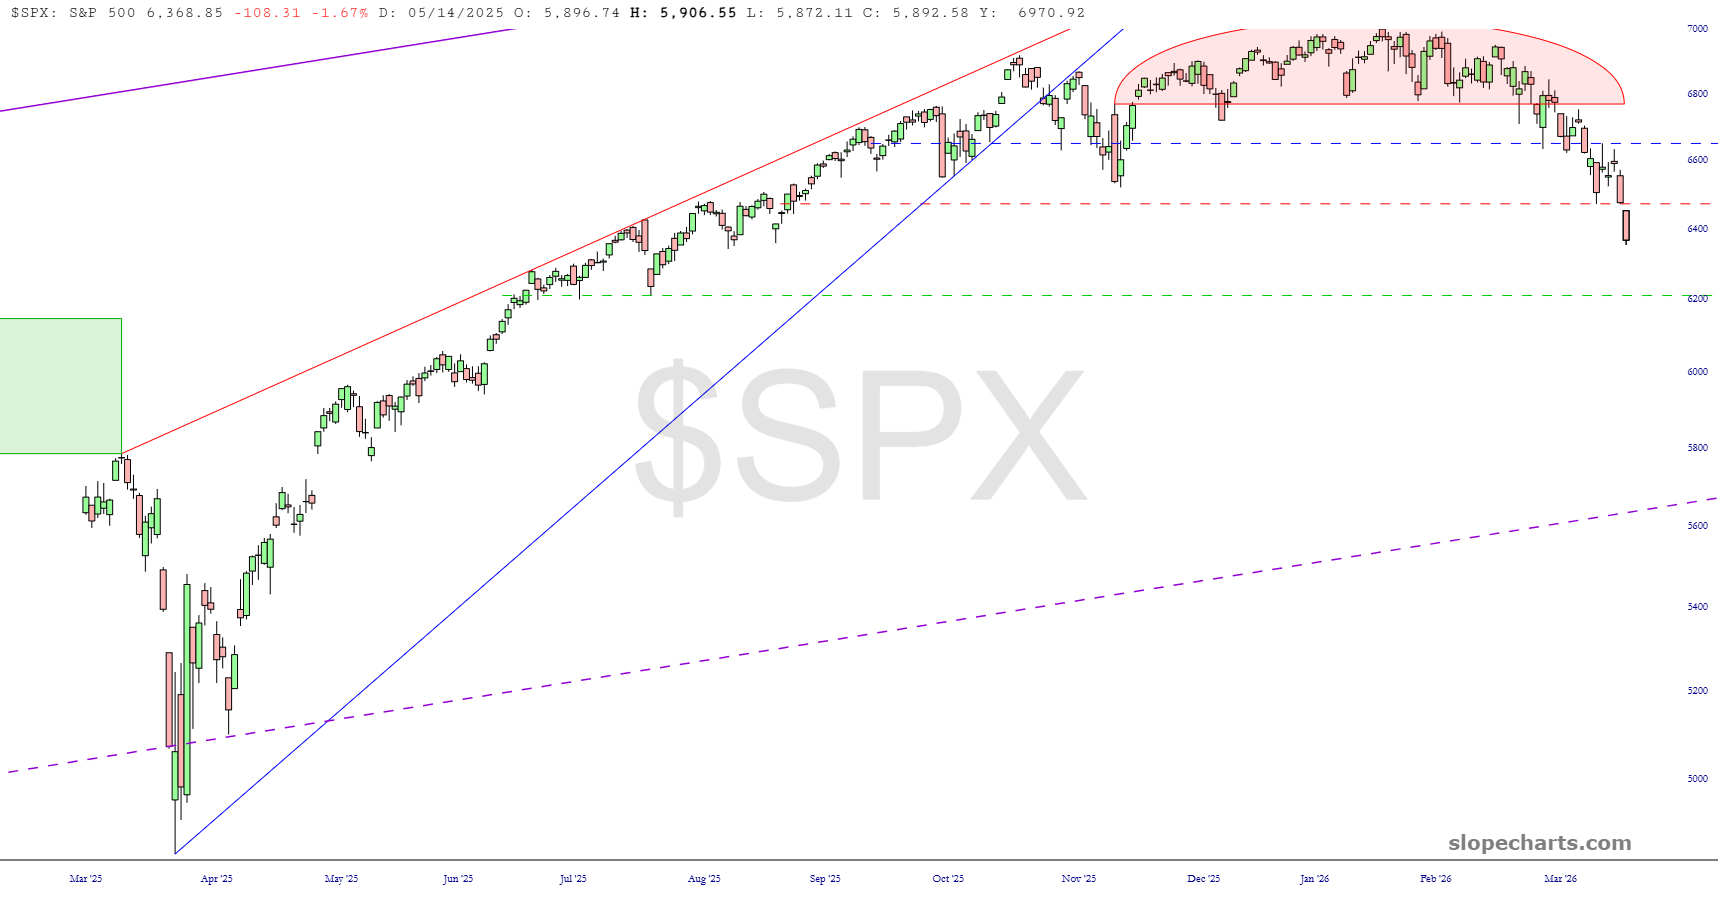
This is an extraordinarily important juncture for the market: we are either so oversold that we’re going to bounce strongly, or else we’re heading into such a big sell-off that the “oversold” state of the market doesn’t even matter. What I can say for sure is that, for the first time in an entire year, the 50-day EMA has crossed beneath the 100-day.
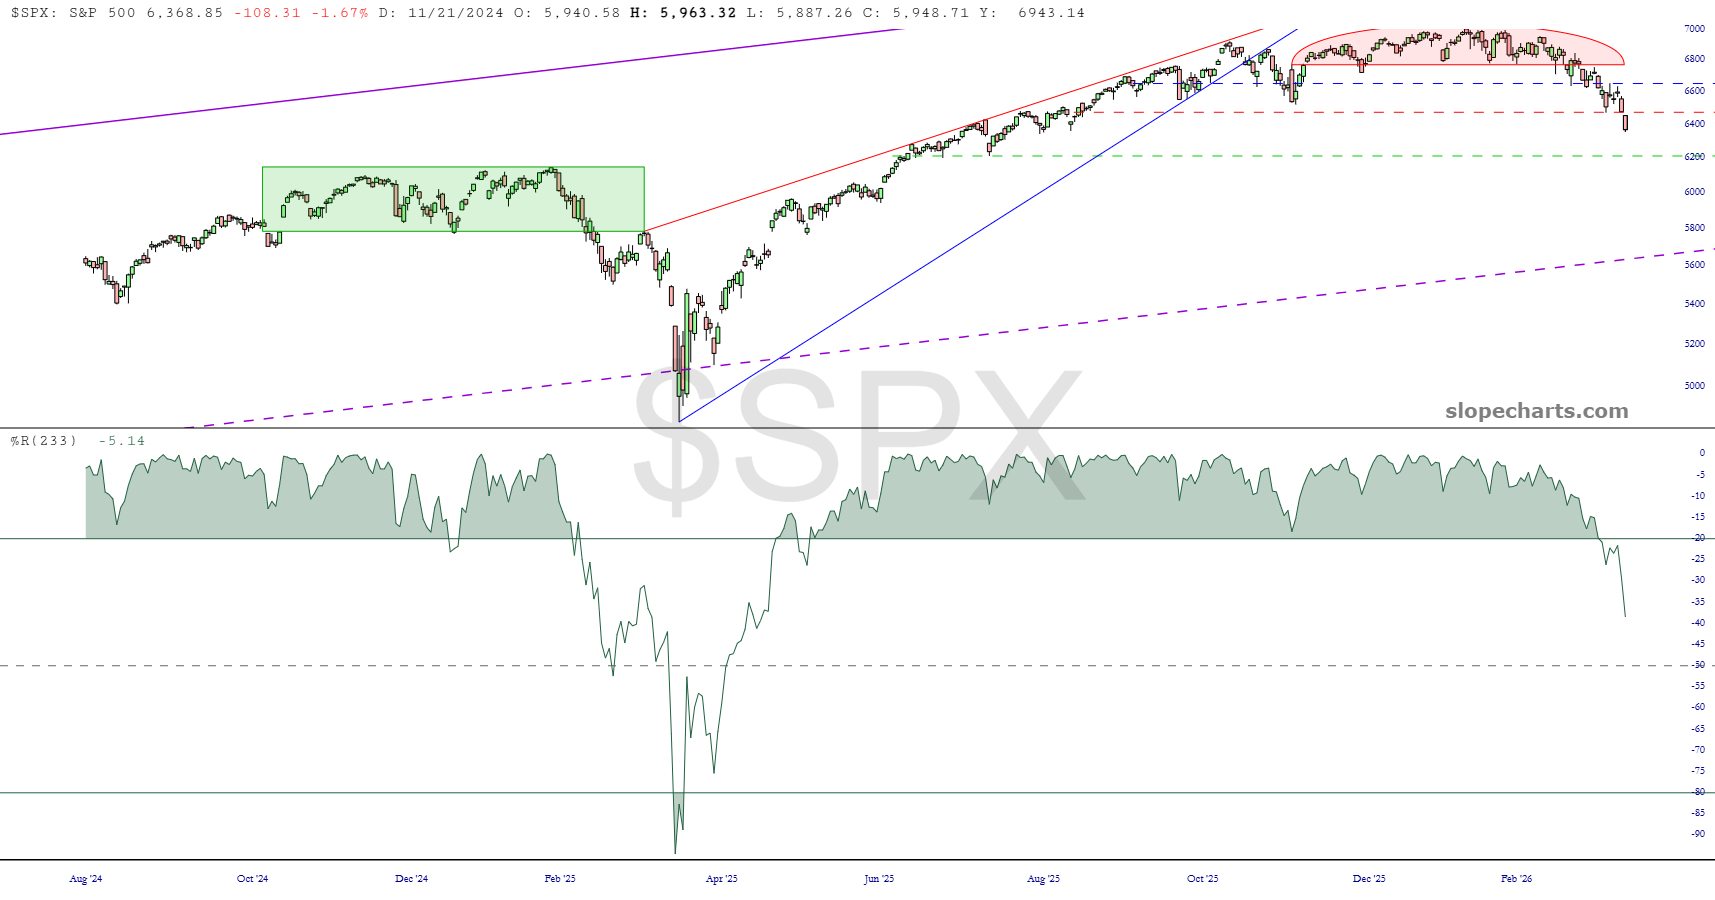
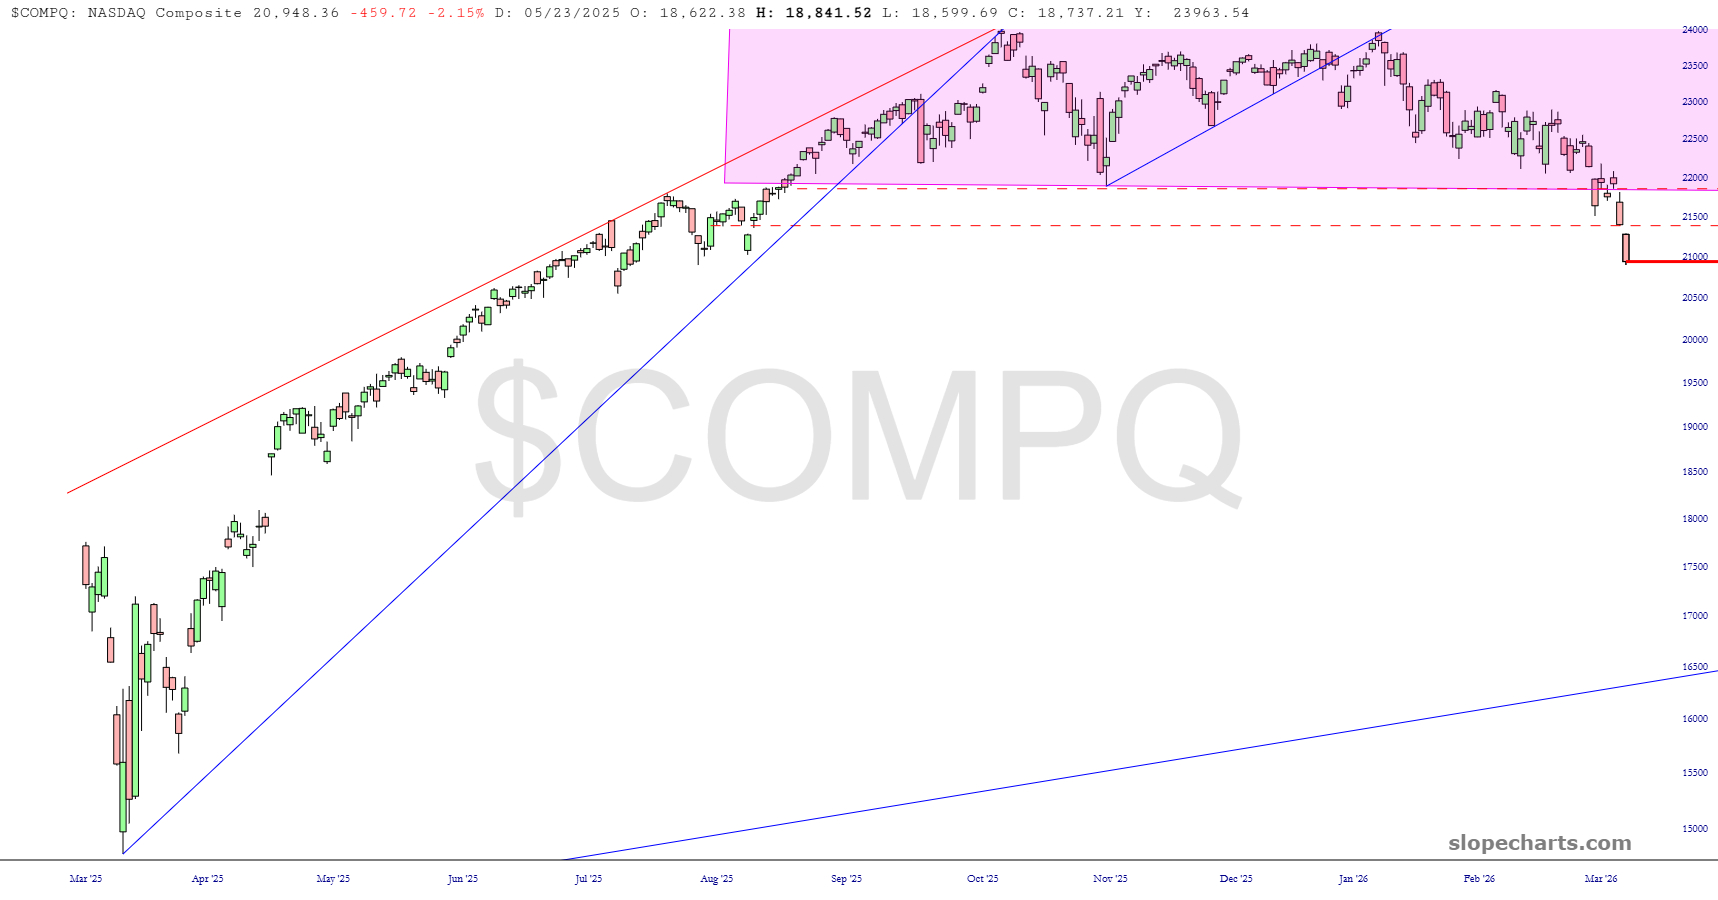
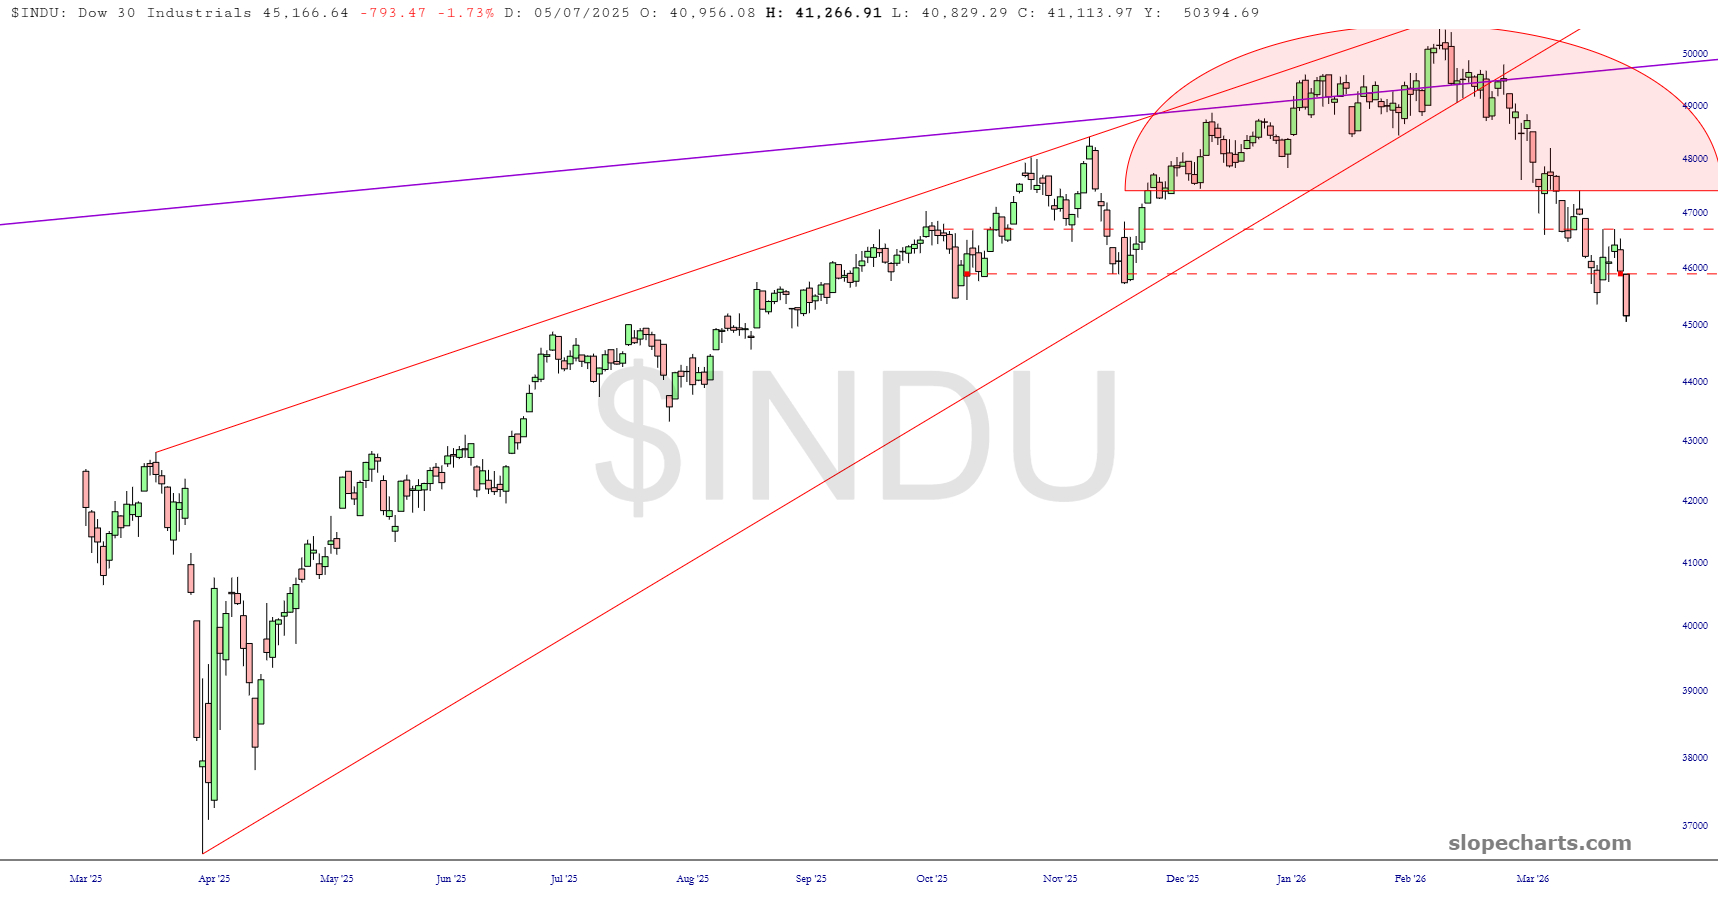
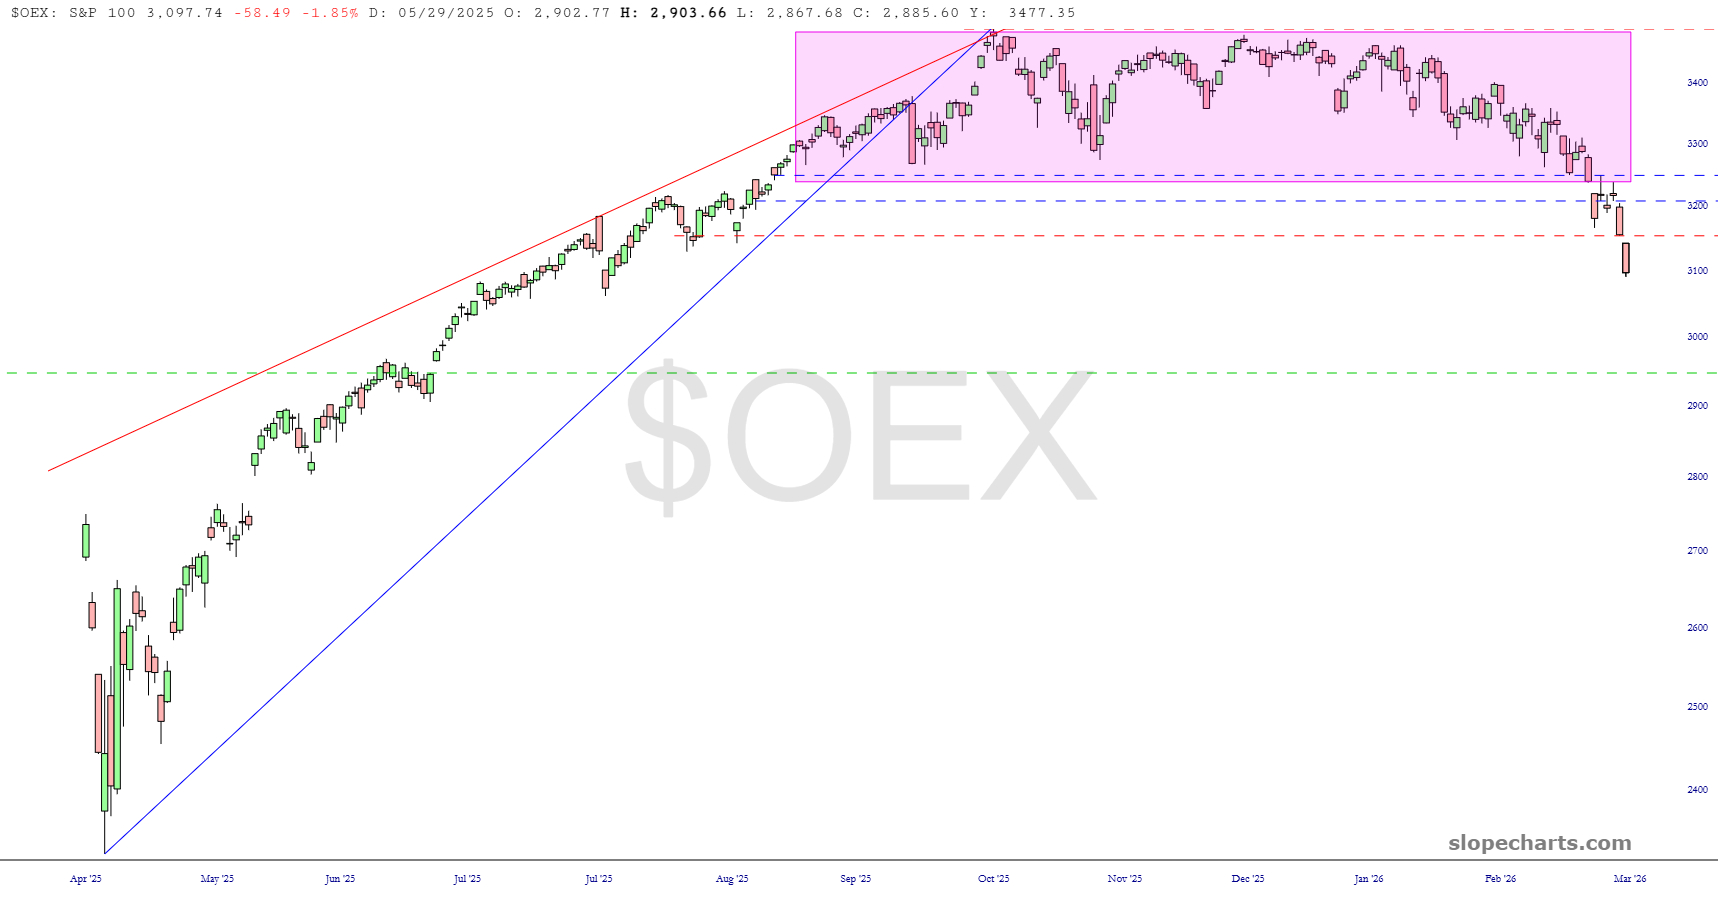
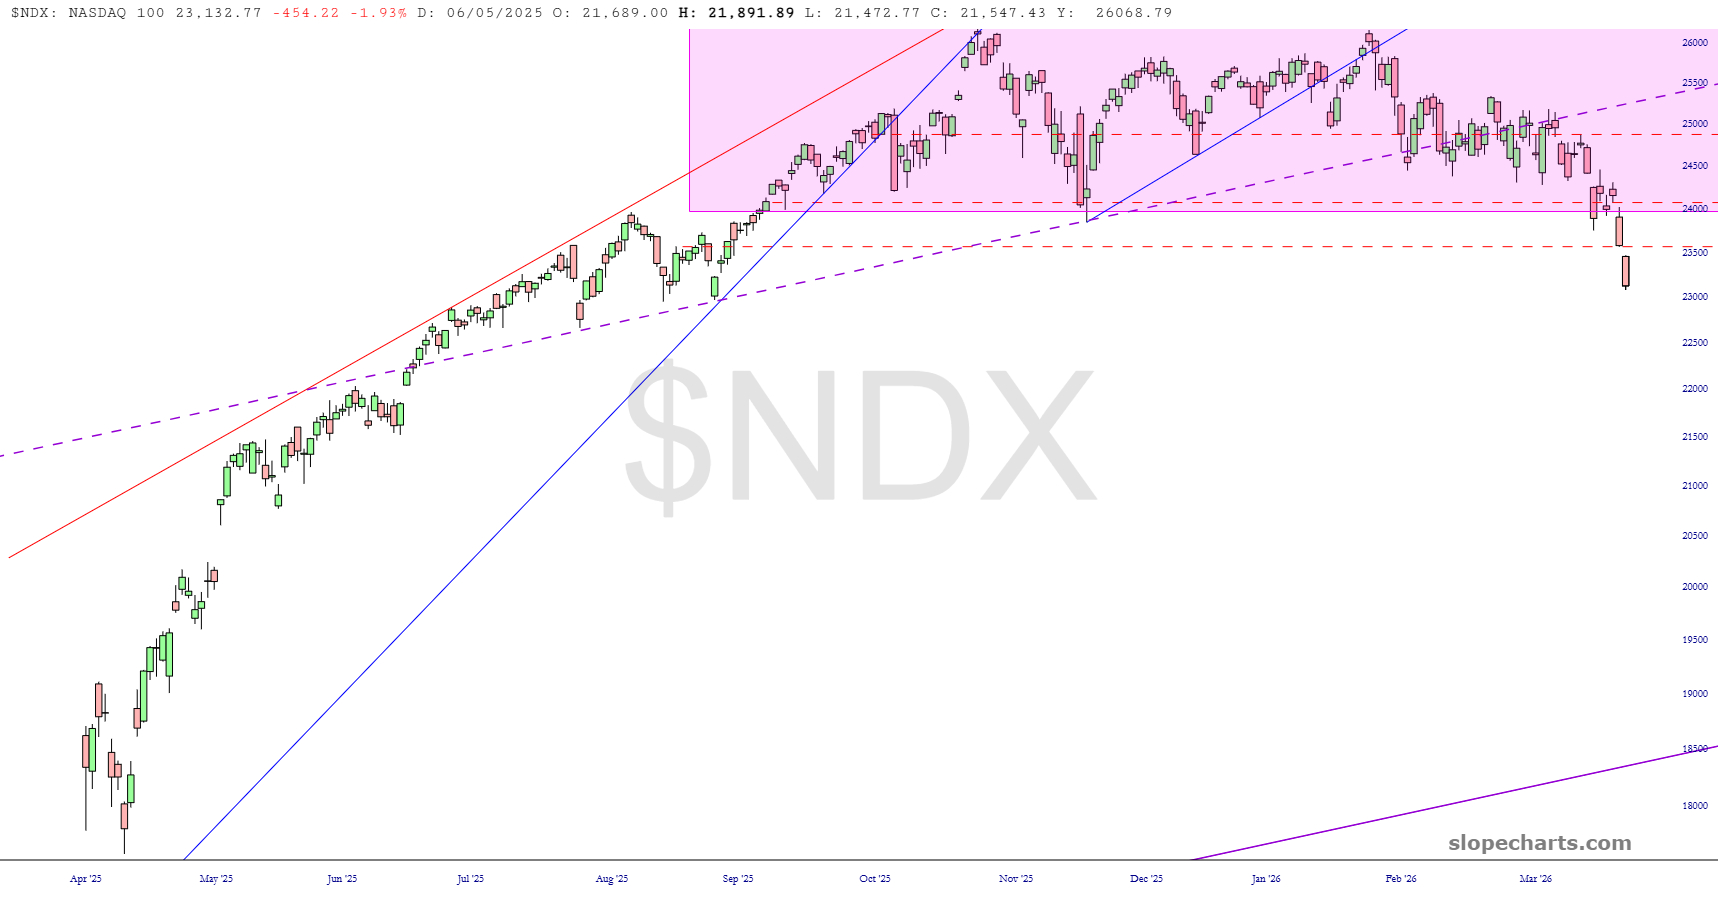
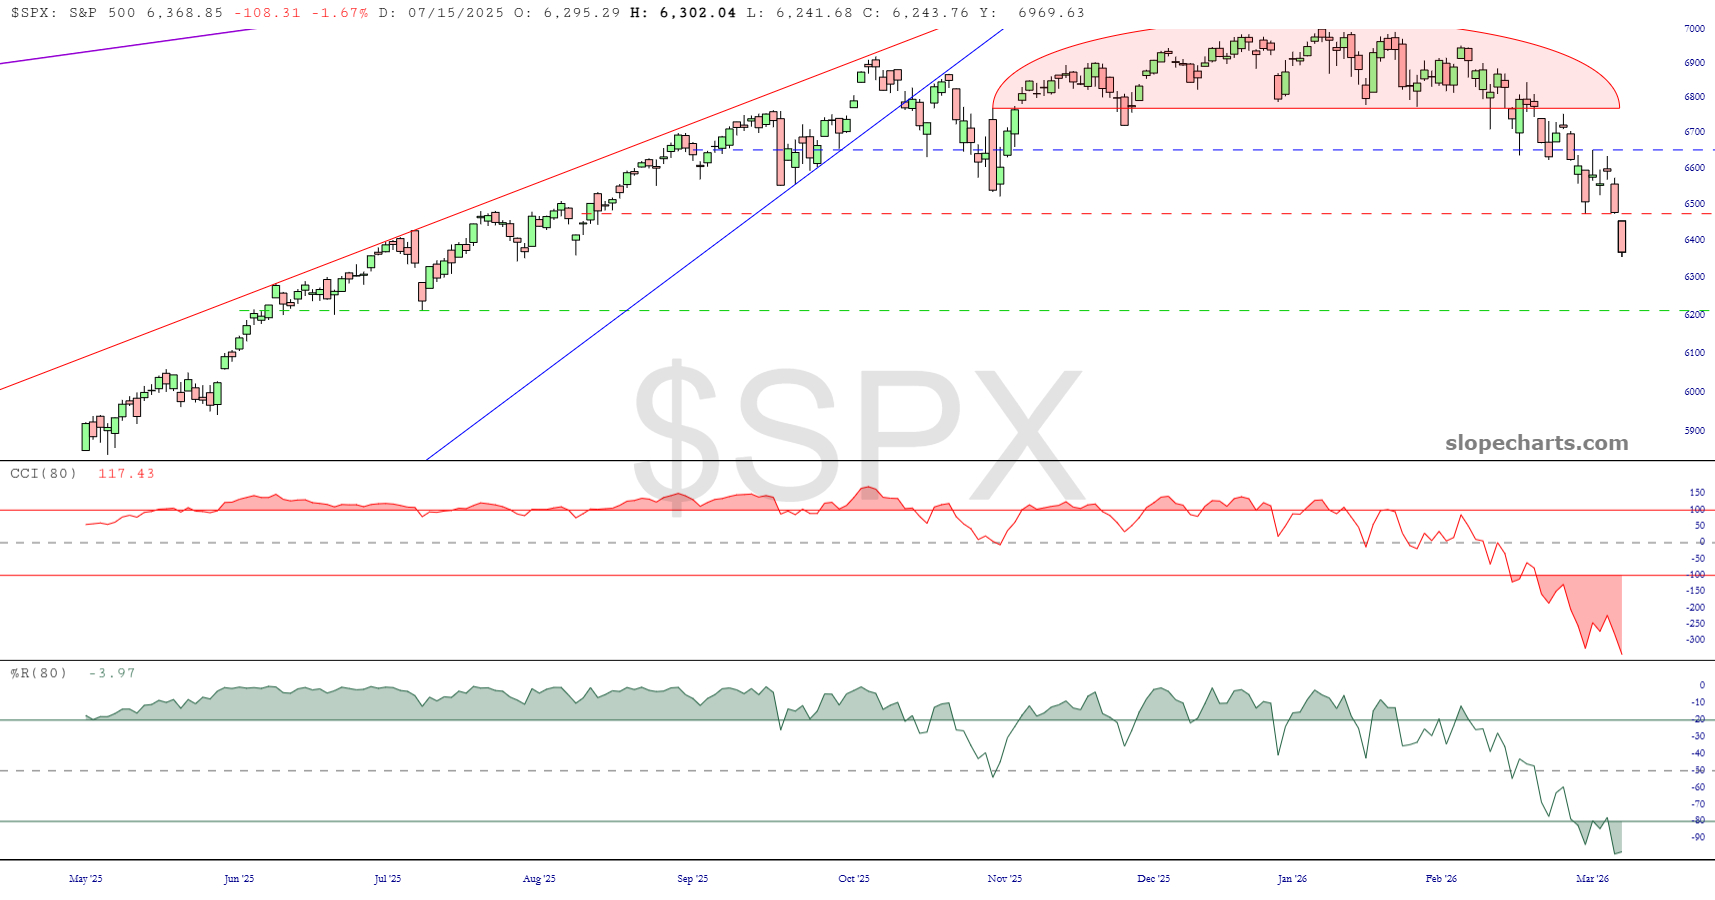
Universally, indexes fell hard on Thursday and Friday, creating a gap each time. The charts below showed a dashed red line for the most recent gap and, where appropriate, higher lines showing former gaps.
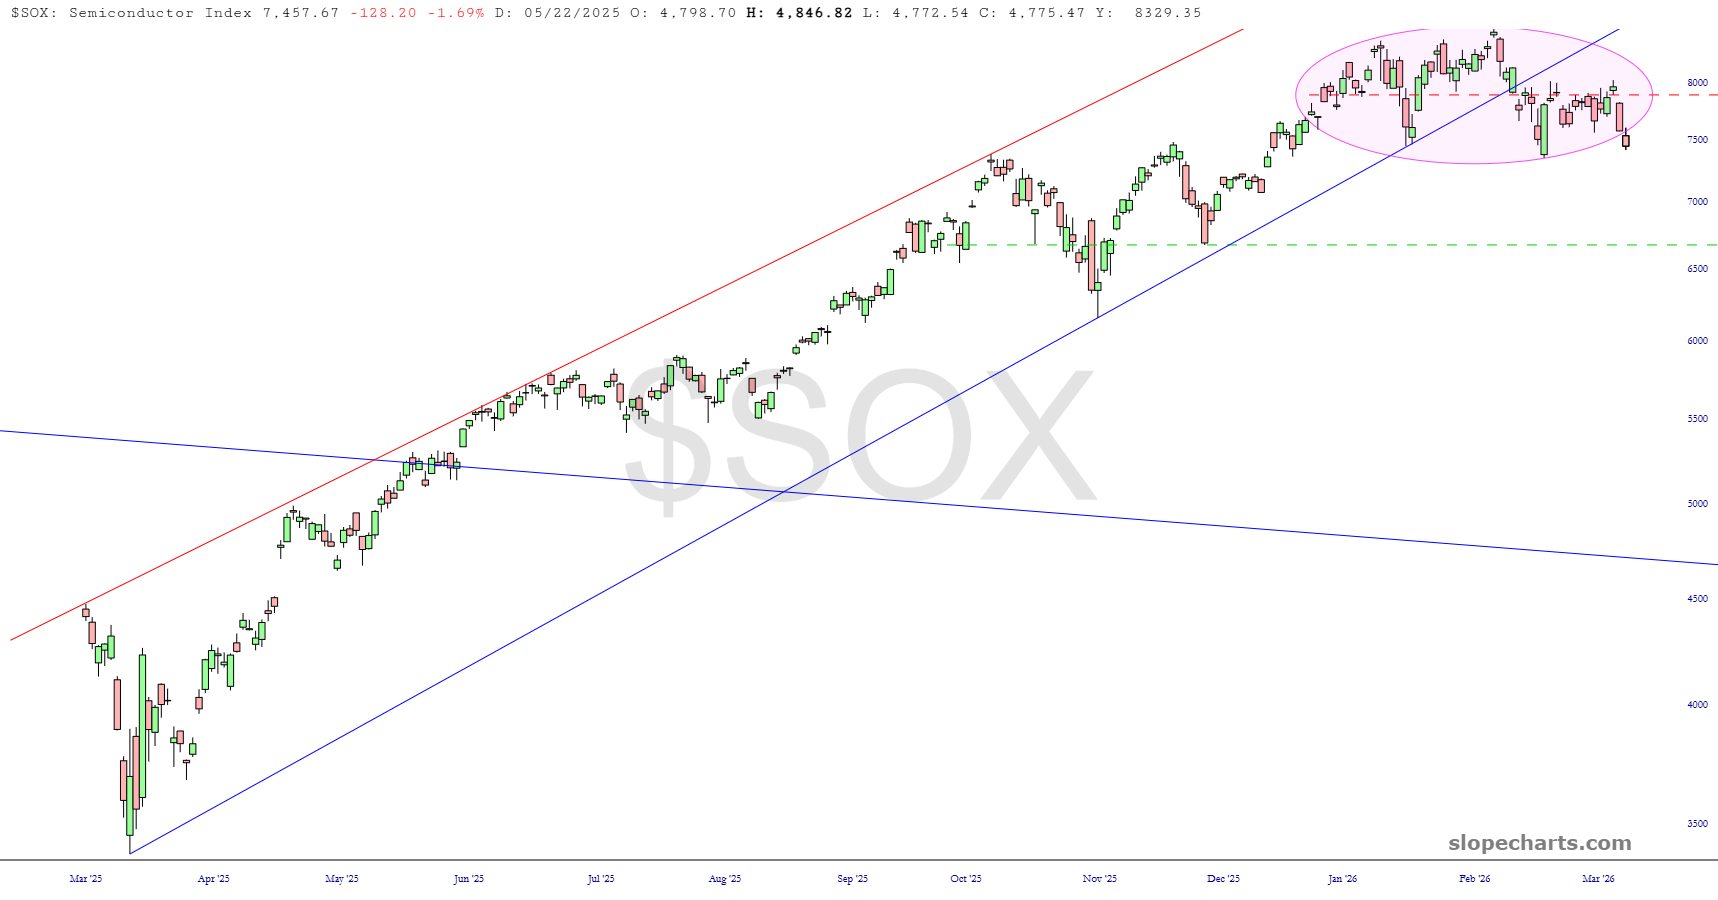
One crucial event that has just taken place is that the diamond pattern for the semiconductor index has completed. This is a marvelously clean reversal top, and I expect semis may well be instrumental in dragging everything else lower.
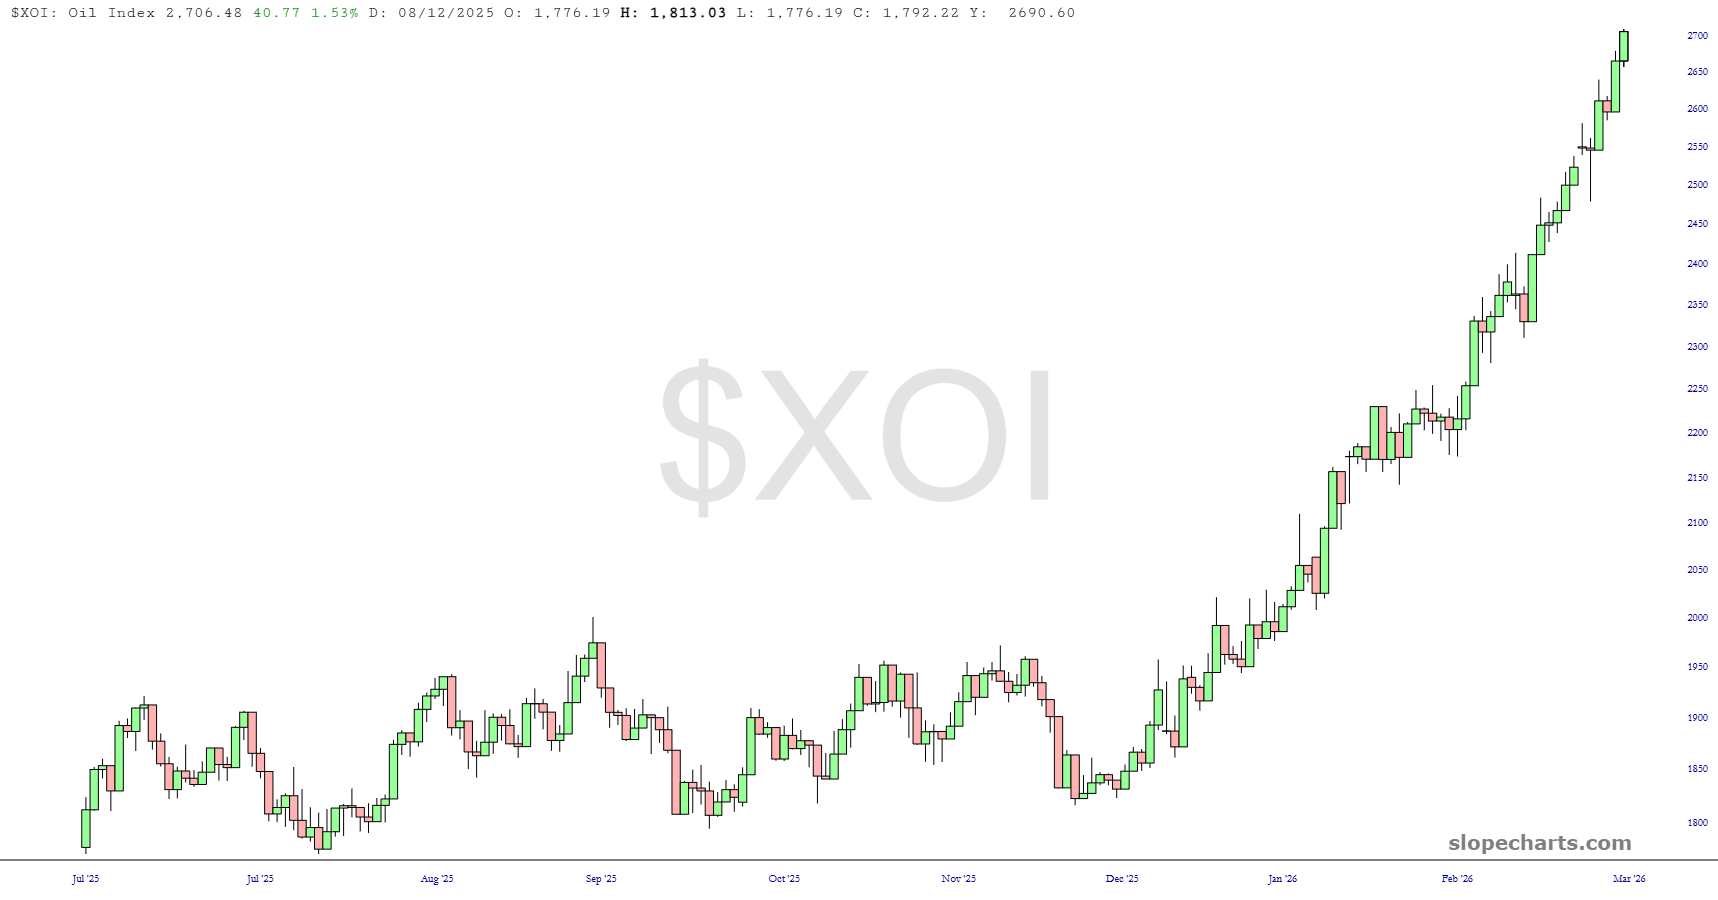
Well, almost everything else!
The market’s top is most decidedly in, and the only question is how big a bounce will take place to undo a portion of the damage, and how long it’ll last. I am nearly certain we’re nowhere near the true bottom.
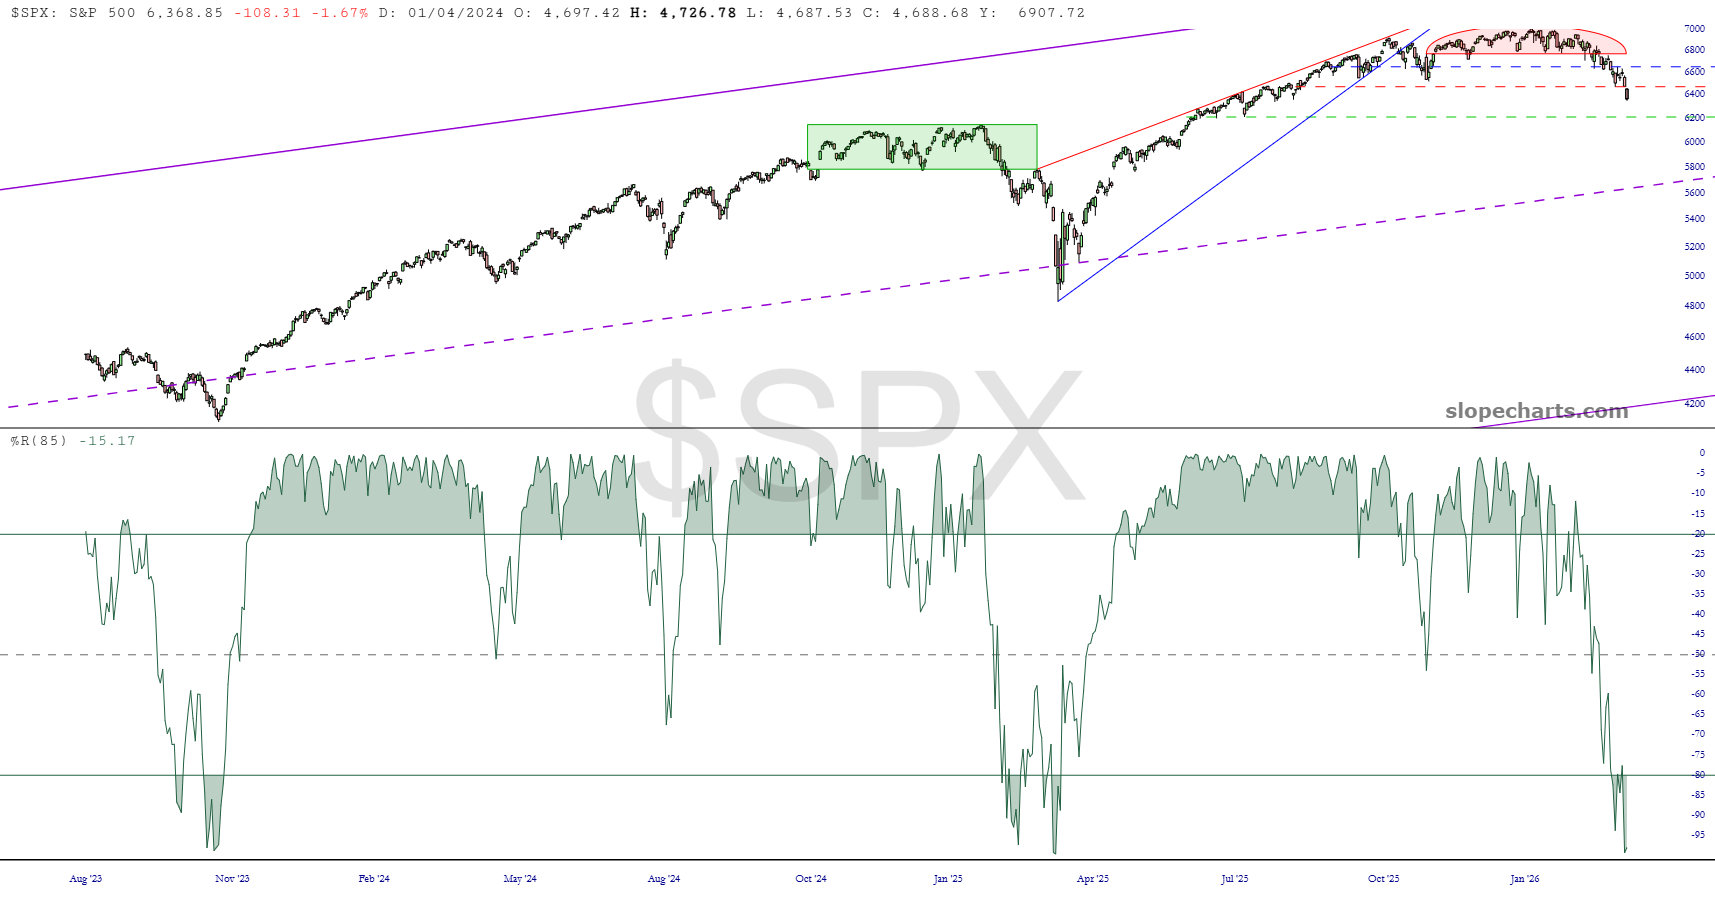
If you want an example of how a market can look oversold and yet not care, please observe the chart below. This may be what’s coming. Maybe.