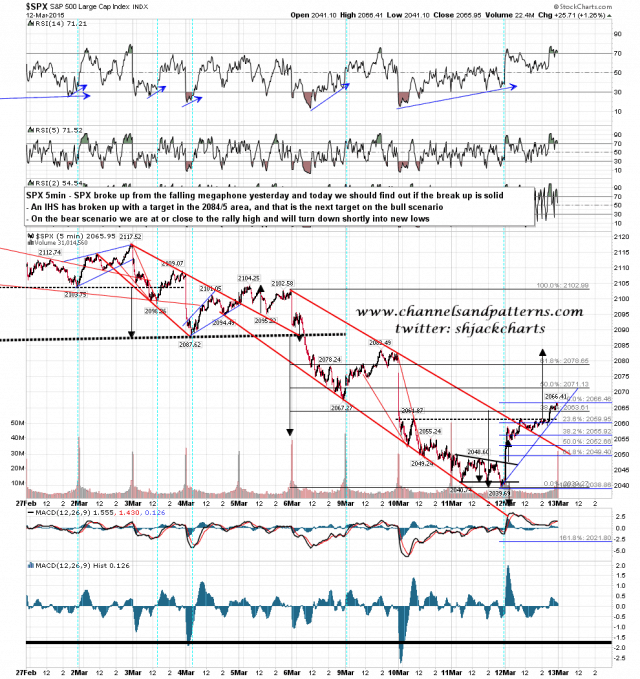
A very solid bounce off main rising wedge support yesterday, and an IHS broke up in the afternoon with a target in the 2084/5 area. If the bulls can follow through today then that is the next big target. SPX 5min chart:
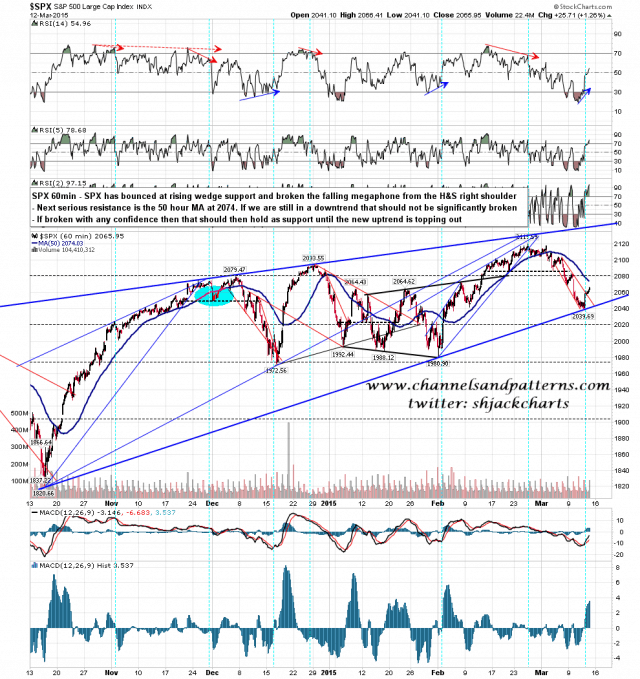
Once over yesterday’s highs the next big resistance is the 50 hour MA in the 2074 area. If this is a rally in an ongoing downtrend then SPX should not sustain much trade over this level. If the retracement low is in, then it should break and turn into support until the new uptrend is topping out. SPX 60min chart:
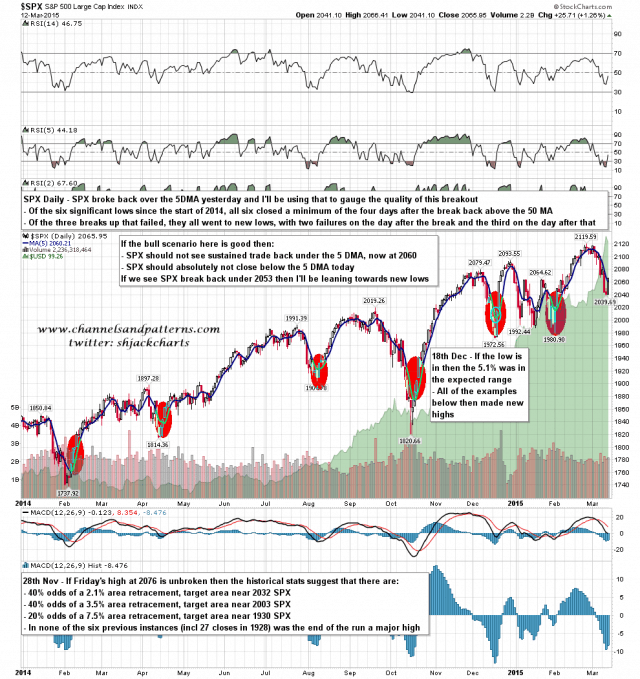
SPX broke back over the 5 DMA yesterday and and I’ve worked up some stats from that break that should allow us to judge whether the bulls really have a good chance that the retracement low was at wedge support on Wednesday. The full stats are on the chart below but the gist is that we shouldn’t see extended trade below the 5 DMA today (currently at 2060), and we must see a close above the 5 DMA today for the bull case, as every instance since the start of 2014 where the bulls failed to deliver that made new lows shortly afterwards. SPX daily 5DMA chart:
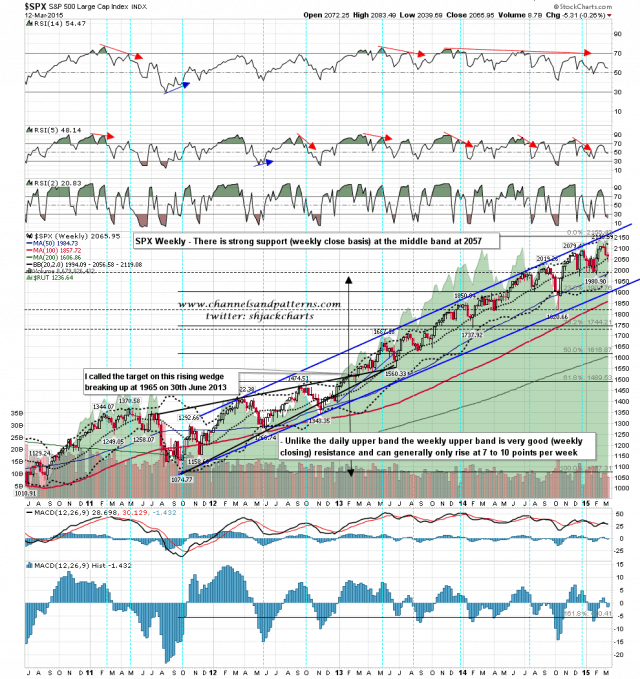
The other key support level to mention today is the weekly middle band at 2056. A break below at the close today would look very bearish. SPX weekly chart:
Looking at the action so far today the bull case is getting into trouble. SPX needs to recover back over 2060 quickly and not return. If we see SPX break under 2050 then the odds will favor new lows in my view.


