
SPX made it to 1990 yesterday, within a handle of the full double top target and we may well see a bounce here. SPX, NDX and RUT have all formed decent patterns from the high and the falling wedge on SPX is breaking up at the open. The falling channels on NDX and RUT have not broken up yet.
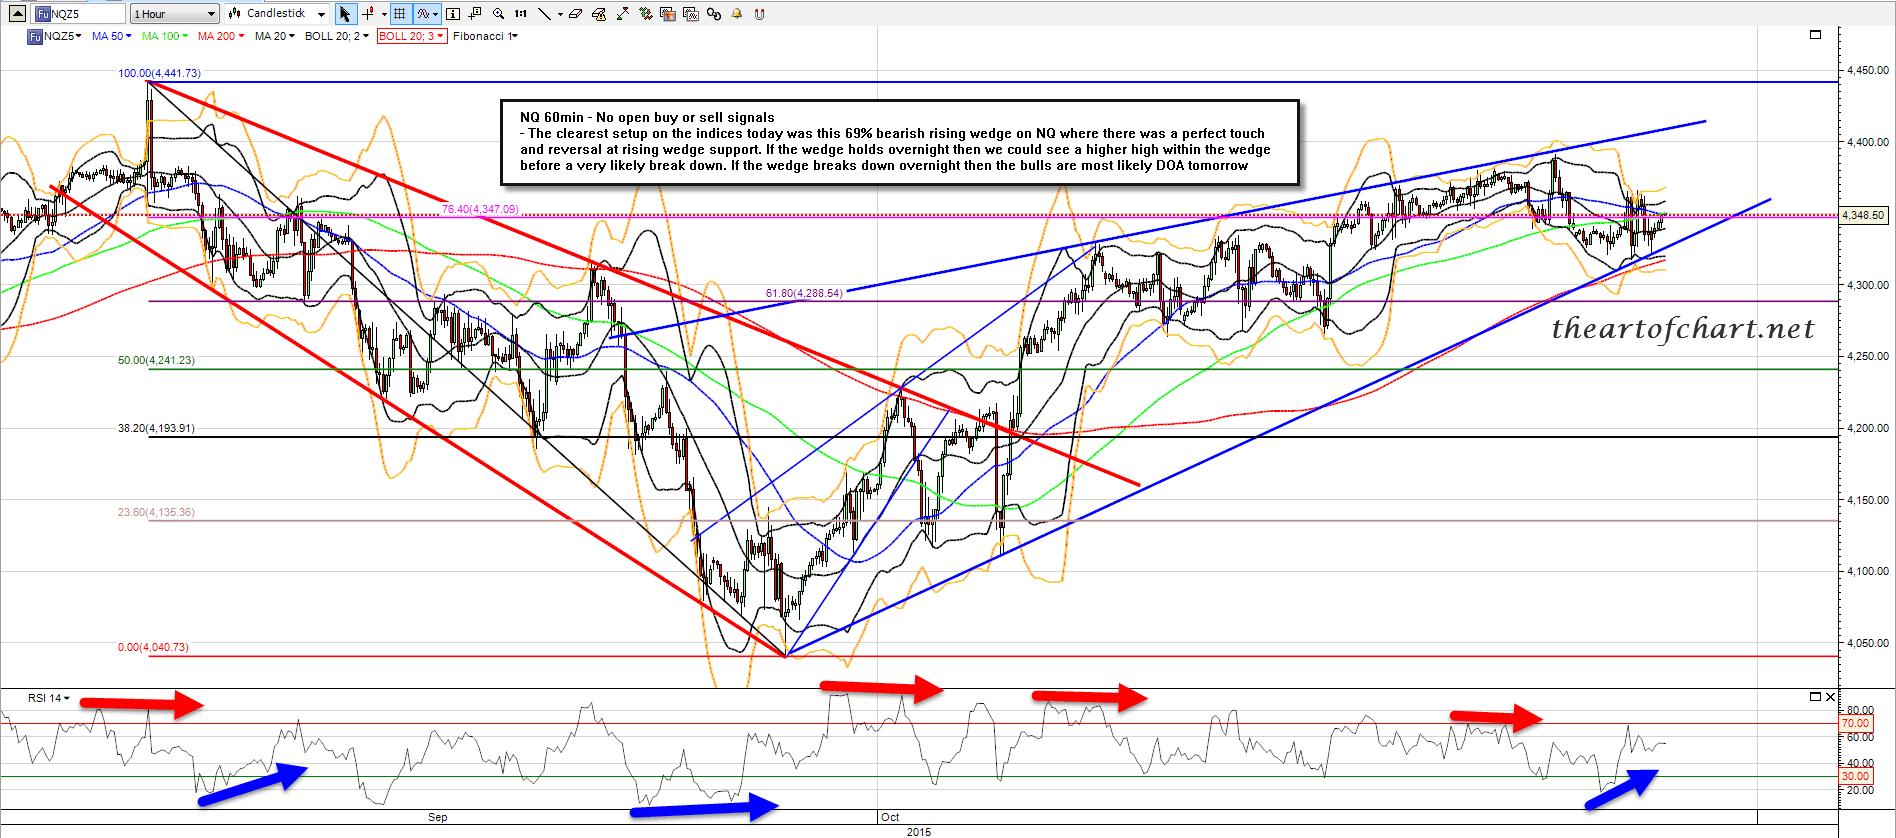
This is a short term inflection point and either we see a bounce to retest the highs, and most likely fail into a larger decline, or we see a break of yesterday’s low and continue the decline. The best bear day would again be from an AM high and fail. The (short term) bull case is best expressed on the NQ chart, where the low yesterday established a very nice falling wedge from the late September low. This chart supports a retest high and fail as long as that wedge support holds.; NQ 60min chart:
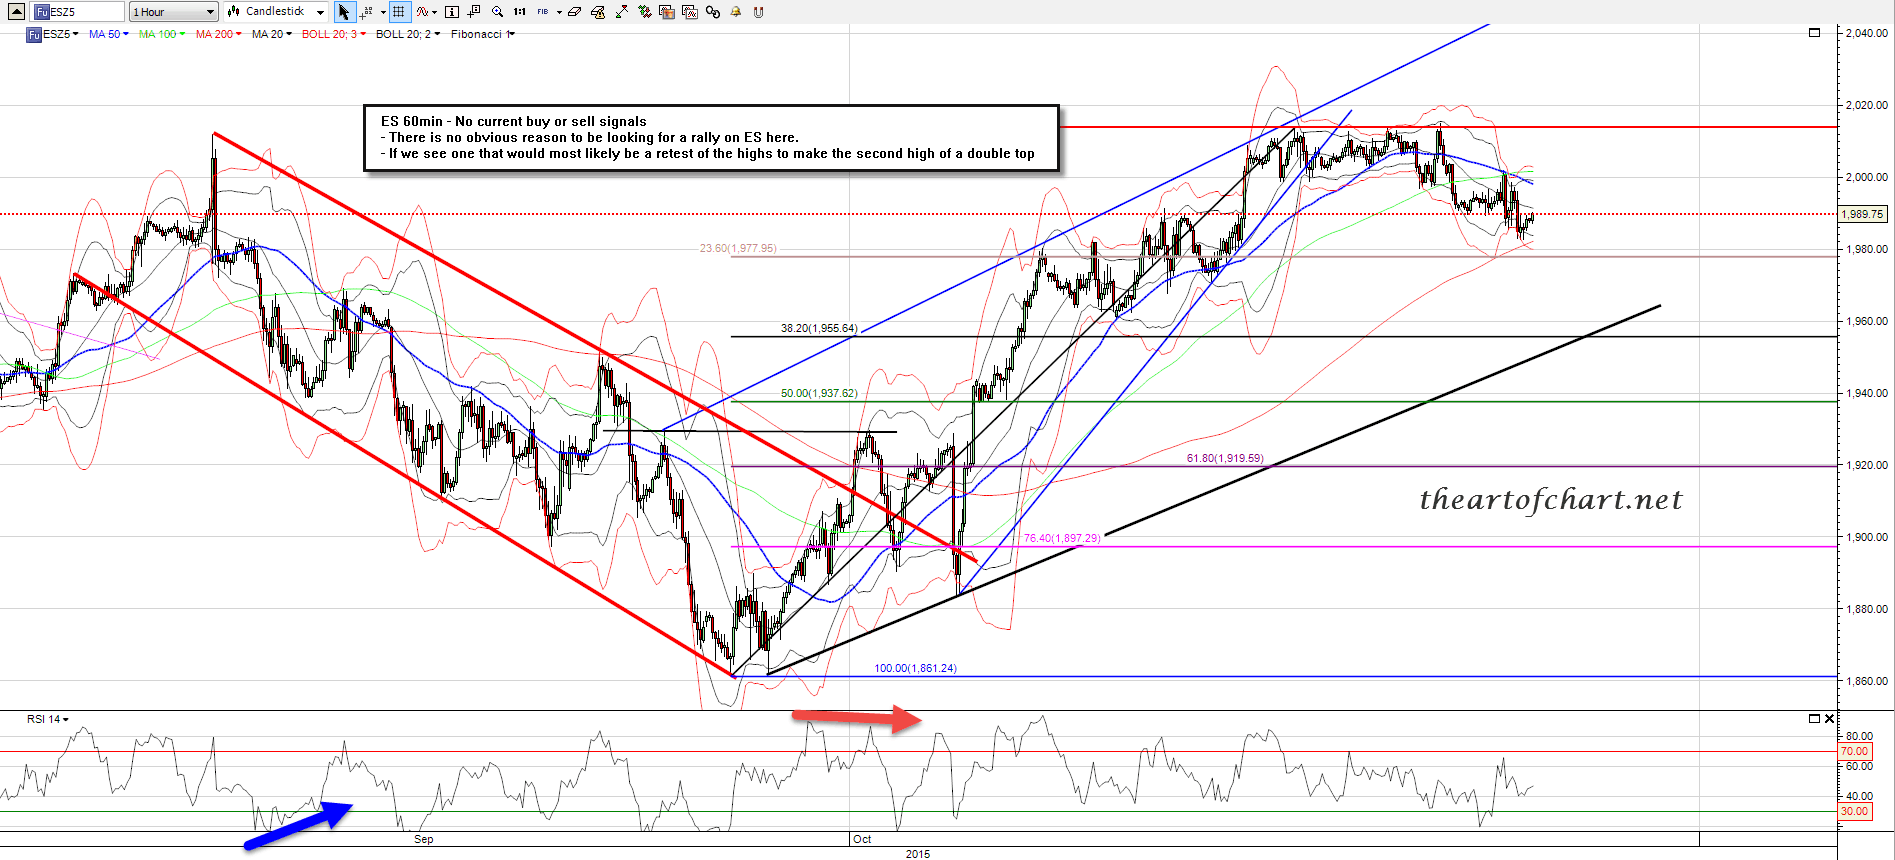
The ES chart didn’t find any obvious support yesterday but there’s room for a second high of a double top in there. ES 60min chart:
Today is the other cycle trend day this week and that could go either way, with 70% odds that the tape is dominated by one side or the other. If 1990 SPX breaks I’d suggest not getting trapped in a long as SPX could drop 200 handles from here in the next three weeks or so. That may sound extreme but I’ll post the $SKEW chart on twitter later this morning. That made an all time high on Monday, with a reading that smelled a lot more of black swan than bull. That doesn’t mean we fall 200 handles from here, but it does mean that it could be a very expensive mistake to get too attached to any long positions.
This ES and NQ chart were prepared for theartofchart.net chart package subscribers but I think I missed including them with the pack posted last night as I was a bit sleep deprived.
