
The 45 day pivot on ES is at 2010 today and in the 70-85 range above that so far today ES has been in Crazytown (70 handles above) and Bet The House (80 handles above). ES has been trading in these areas all week so, as I mentioned a week ago, SPX is very vulnerable to a sharp correction starting here, and the chances of starting another significant move up from this area are low. Not much to see on the short side here until we see some support trendlines break but the next likely significant move is highly likely to be down, so there’s not much to see on the long side here either, other than intraday.
When was the last time we spent several days trading at these kinds of extremes? Just before the October low. Just sayin’.
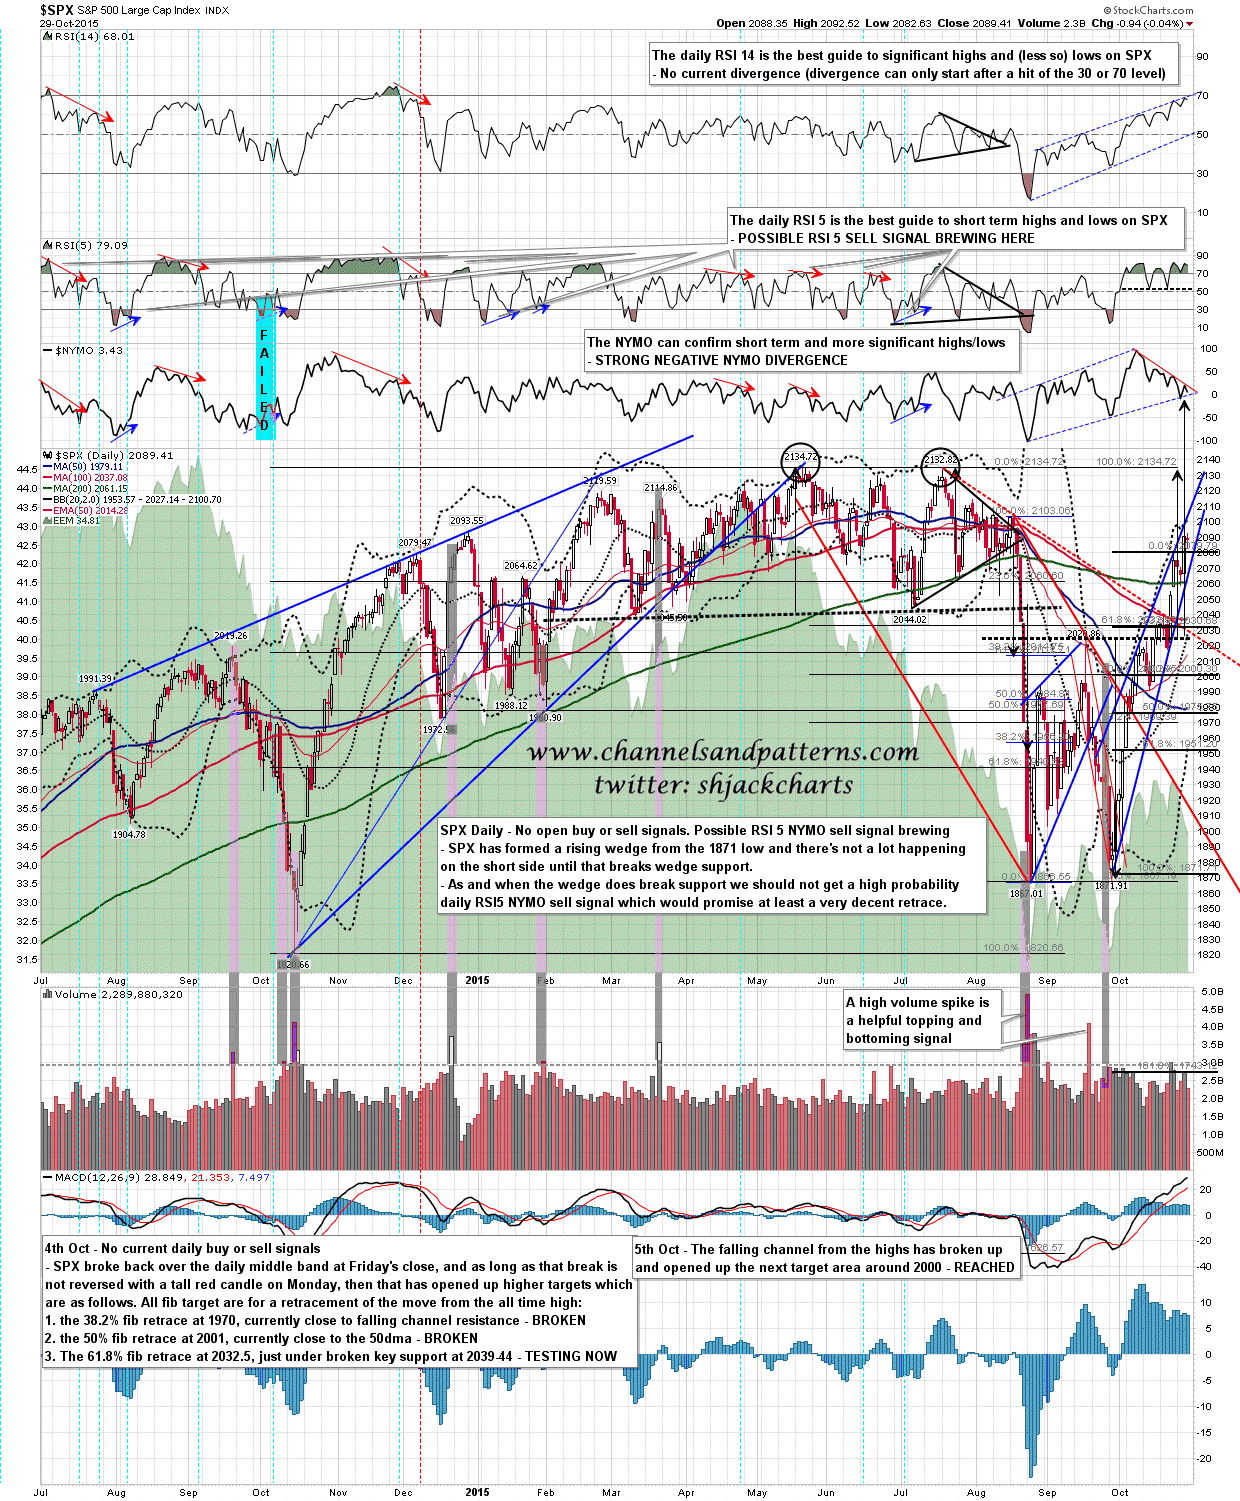
As and when the bears can deliver a decent day or two downside I have a high probability daily RSI5_NYMO sell signal brewing. As and when that signal fixes we should see a decent decline, which I’d be expecting from this area soon in any case. SPX daily chart:
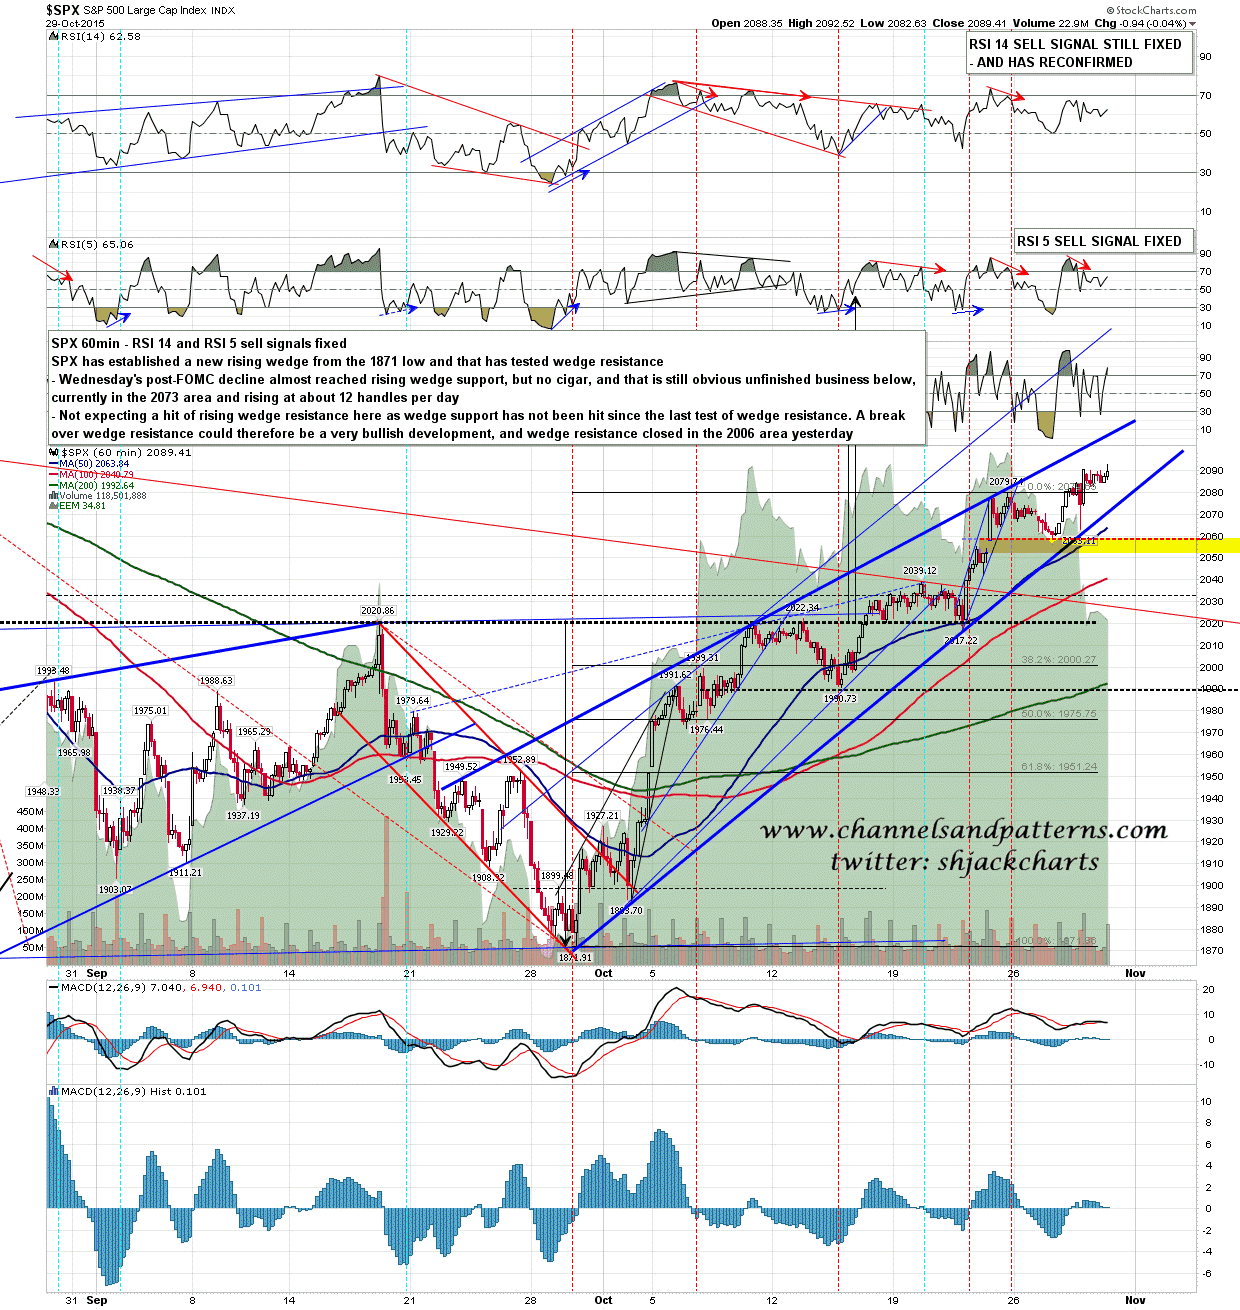
SPX is on a 60min sell signal here and could fail at any time. the next intra-wedge target is wedge support, currently in the 2072 area and I’d be expecting that to break down at the test. SPX 60min chart:
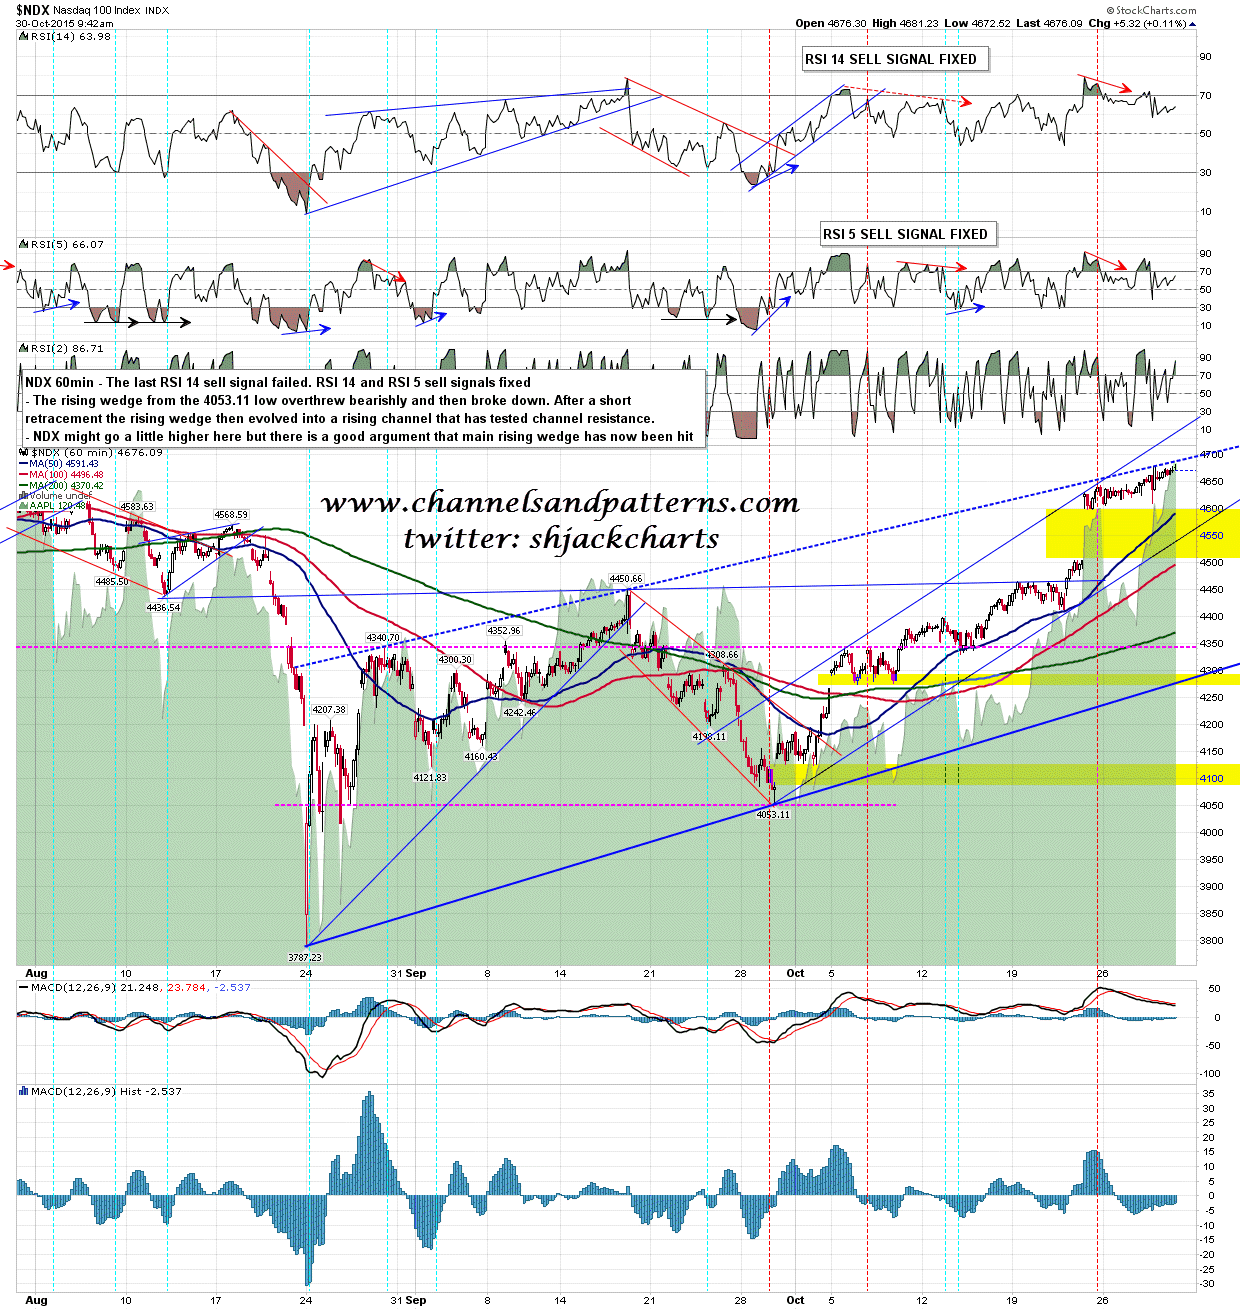
I’ve been looking for an NDX target at likely rising wedge resistance and we may have seen that now, though there is space to go a little higher still. Again NDX is on a 60min sell signal and could fail at any time now. NDX 60min chart:
We are doing a free Chart Chat at theartofchart.net at 4pm EST on Sunday and will be looking at options going forward on equity indices, USD, EURUSD, GBPUSD, oil, nat gas, gold, silver, gdx etc. I can promise that it will be extremely interesting. If you don’t find it interesting due to a lack of interest in fine TA, then it will at the least be informative and free 🙂 You can sign up to see that here.
