
“All of us show bias when it comes to what information we take in. We typically focus on anything that agrees with the outcome we want.” – Noreena Hertz
I have been wanting to write this article for some time now this year. I wanted to wait until the results I was attempting to achieve became overwhelming. I think we’re there, so I am eager to share. Before I do, let me take a step back and share briefly my history as a trader and investor. I would divide my investing & trading history into three segments.
1998-2007 – Long term investor. Buying and holding assets.
2007-2014 – Combination of buying long term investments & discretionary trading
2015 – Combination of buying long term investments & ATR based trading
I graduated from college in 1998, began working, and investing. My focus was accumulating capital, and putting it to work buying companies that I believed in, understood, had good balance sheets, and for the most part paid dividends. It worked. I enjoyed it. I was good at it. At this point in my life my expertise was understanding companies, not the global economy, or technical analysis. My father was an executive, and my brother was an entrepreneur. I had grown up in business, and been educated in the management of companies.
At Thanksgiving dinner of 2007, my brother asked me what I was planning on doing with my investments if we saw a housing collapse. A housing collapse? Was that possible? What would cause it, and what would be the effect? My brother made such a compelling case, I immediately began investigating it. Thus began my journey into understanding not only economic and financial fundamentals, but a journey into how to successfully hedge my investments, and profit from trading.
During the 2007-2009 timeframe I was going through intensive study, learning, and experimentation with trading and technical analysis. I found the Slope, as well as many other sites and books. I liked technical analysis. It suited me, and gave me a new method for understanding markets. I enjoyed shorting the market as it fell in 2008 and 2009, and it gave me the means to protect what I had built for the last decade.
Certainly a period such as 2007-2009 is capable of molding ideas, some would call the birth of bias, as extreme market conditions, coupled with an awakening to technical analysis and economic/financial fundamentals take root.
However, as the bull market of 2009-2015 took root, technical analysis became more frustrating. I found periods of great success, 2011 in particular, but also prolonged periods of repeatedly getting stopped out, and missing opportunities in the opposite direction. Did technical analysis simply “not work” during a QE regime? Or was there a better way to make money in the trading side of my account?
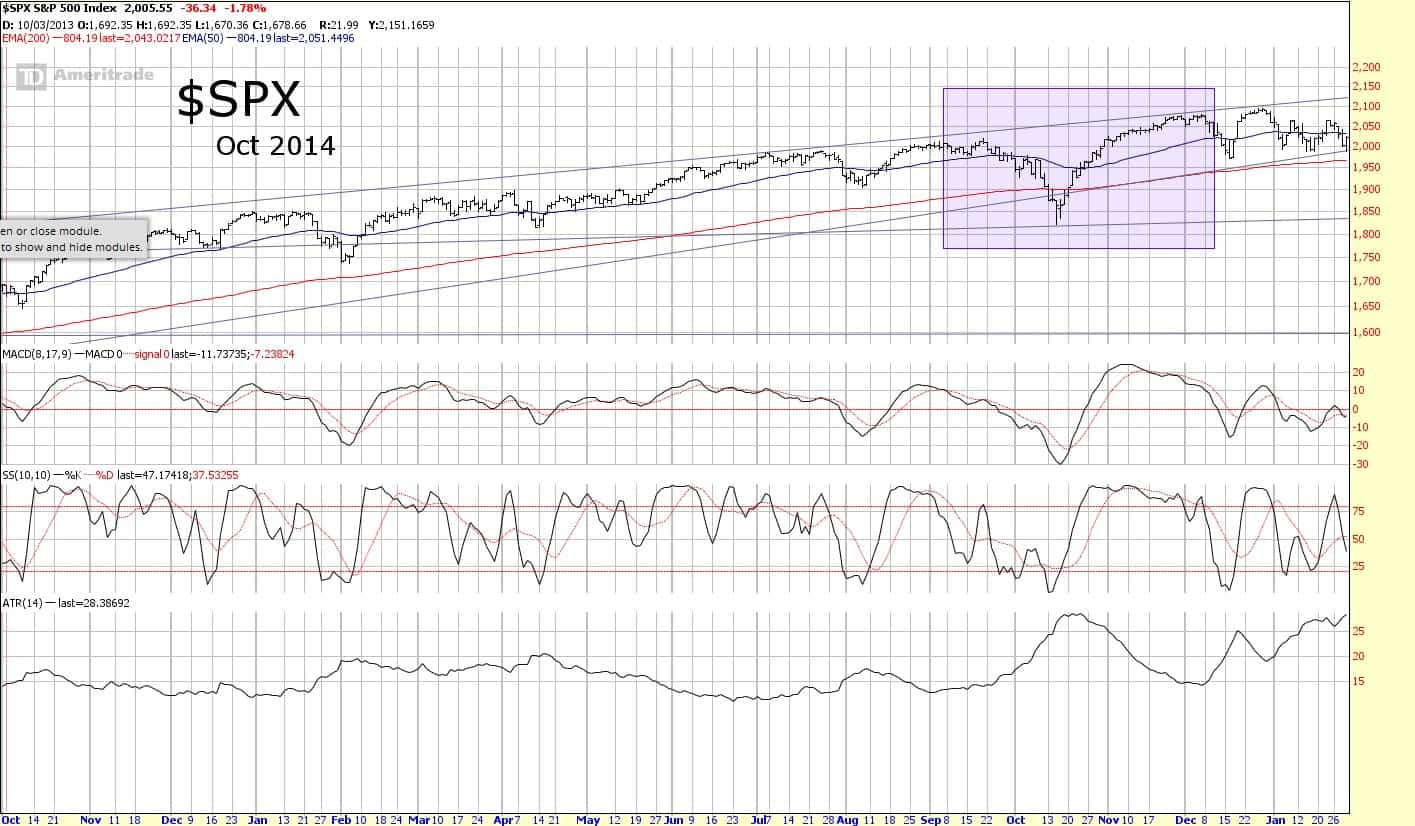
My journey to the third stage of my trading career came to a head in October of 2014. The large rising wedge that had formed on SPX for 5 years was breaking down. We saw a significant decline as we broke the wedge, and I made a significant profit. After so many failed attempts to end the bull market, was this it? I had done a fairly good job of trading the decline, and got out near the bottom. As the market reversed, instead of getting long and holding, I was looking for an opportunity to re-enter short after a retracement. What followed was a historic rally the likes of which the market had never seen. This left me with repeated short entries and stop outs. Frustration finally gave way to change, and ATR based trading was born.
First of all, hat tip to Market Sniper, as this trading strategy was inspired by one of his. I wanted a way to make consistent profits, and always trade on the right side of the trend, regardless of direction. Let’s take a look.
The changes I have made are technical, but also represent a change in thought, which is of greater value. Bias is your enemy. In life, and in making money, you will miss out on opportunity by harboring bias. Next, while traditional technical analysis can give you trading opportunities, and help in seeing the big picture, it is price, and more accurately the price level at which trends change that is of the most value.
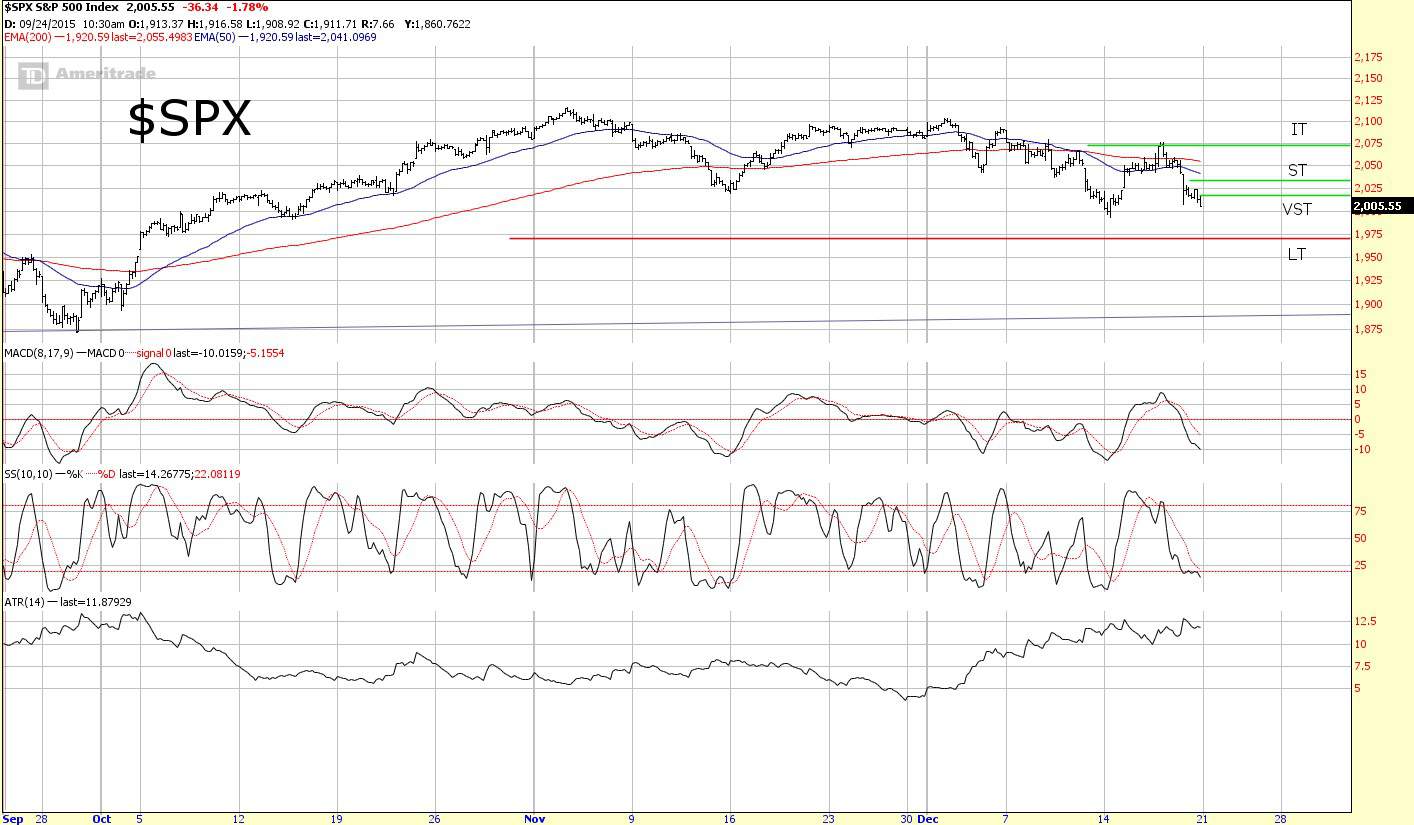
If you have seen any of my charts on SocialTrade this year, you’ve noticed some horizontal lines as well as some letters. VST, ST, IT, LT. These stand for very short term, short term, intermediate term, and long term. These represent the levels at which trends change on different timeframes. They are calculated by using ATR (Average True Range) values on multiple timeframes. Very short term is calculated based off hourly ATR, short term on daily ATR, intermediate term on weekly ATR, and long term based on monthly ATR.
The goal of ATR based trading is to always be on the right side of the trend, and to profit off the bulk of a trending move. You will find that during periods of sideways chop, it is important to find ways to preserve trading capital, with the expectation of making the bulk of your returns during trending moves.
ATR based trading seeks to first establish the direction of the current market trend on a given timeframe, and then importantly, establish the price level at which the trend will reverse. For example, let’s take a look a the current setup on SPX as of Friday’s close. The levels shown in green, are price levels at which point a buy reversal will take place. The level shown in red is the level at which as sell reversal will take place. As you can see the green line slightly above the closing price is the VST (very short term) buy reversal level. In a downtrend, the reversal levels are calculated by taking the most recent low closing price, and adding the current ATR. The reverse would be done in an uptrend.
So, on the hourly chart, which is what the VST levels are calculated on, the market closed on the lows, therefore we take the hourly bar closing price of 2005.55 and add the ATR of 11.88. This gives us a reversal level of 2017.43. On Monday, if the next hourly bar closes at a new low, I would move the reversal level down by setting a new ATR calculation. However, if the market moves up, I leave the initial reversal level in place, until an hourly bar closes above it, or new lows are achieved. When a bar on a given timeframe closes beyond your reversal level, the trend has now changed on that timeframe.
So how is this best used to make money? I primarily use the ST and VST levels to make trading decisions. I want to take part in ST trends, long or short. This is the best place for me as a trader to profit at this point in my career. Once a ST reversal happens, it is not always in the best position to immediately enter a new position. This is where technical analysis can play a useful role. Once you see a reversal happen, have a look around and see if an entry makes sense. If not, wait for a better entry, and then enter with confidence knowing that the trend is on your side, as well as having a clear picture of where that could change and where your stops should be placed.
Knowing when to take profits is also key. As short term trends progress, you will begin to accumulate healthy profits. You will also notice that the trend gets overbought/oversold depending on direction. Should I cover? Why would I cover? The easy answer is just wait for another ST reversal to occur, and then take profits.
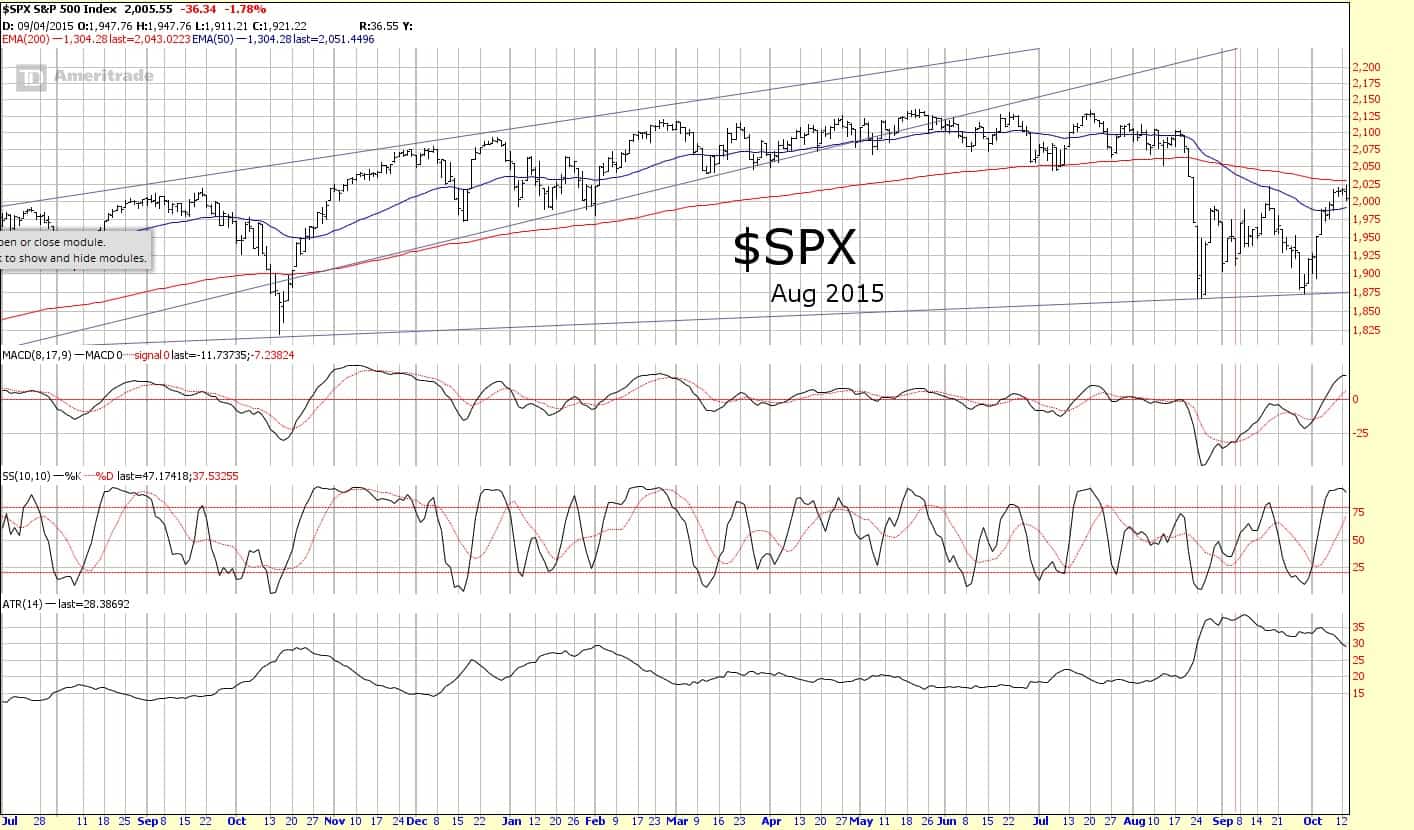
This is not always the best tactic. Realize that in this trading style, there is no need to be bound by always looking for the “huge move”. Achieving repeated 1-3% gains in SPY, or 5-10% gains in VXX can compound quickly. An example of an extreme move is certainly the plunge that we saw in August. ATR based trading would have got your short SPX on 8/19, as the market began to move down in earnest.
You would have remained short going into the weekend, with a ST buy reversal level of 2095.65 going into Monday. The market then plunged on Monday, you would have remained short with a new reversal level of 1923.64 going into Tuesday, at which point you would have covered, in spite of the fact that the market got as low as 1867 on Monday, that’s 56 SPX points left on the table. What if instead the market had to continue to violently rally on Monday afternoon? Capitulation would have been obvious to the naked eye, and your profits would have been shrinking. This is where VST levels become useful for profit taking.
Obviously moves like August 2015 and 2011 are rare. With that said, don’t be afraid to take profits, or at least partial profits, but wait at least for a VST reversal to occur before you do. Have a reason, based on changing price trends, to make your decision. Oversold markets can always go lower, and Lord knows October of 2014 has taught us that markets can always go higher.
Enjoy your trading, and may great profits await the Slope in 2016.
