
As usual on Mondays I’m using the charts I did for theartofchart.net subscribers last night. The ES chart was capped before the globex open last night.
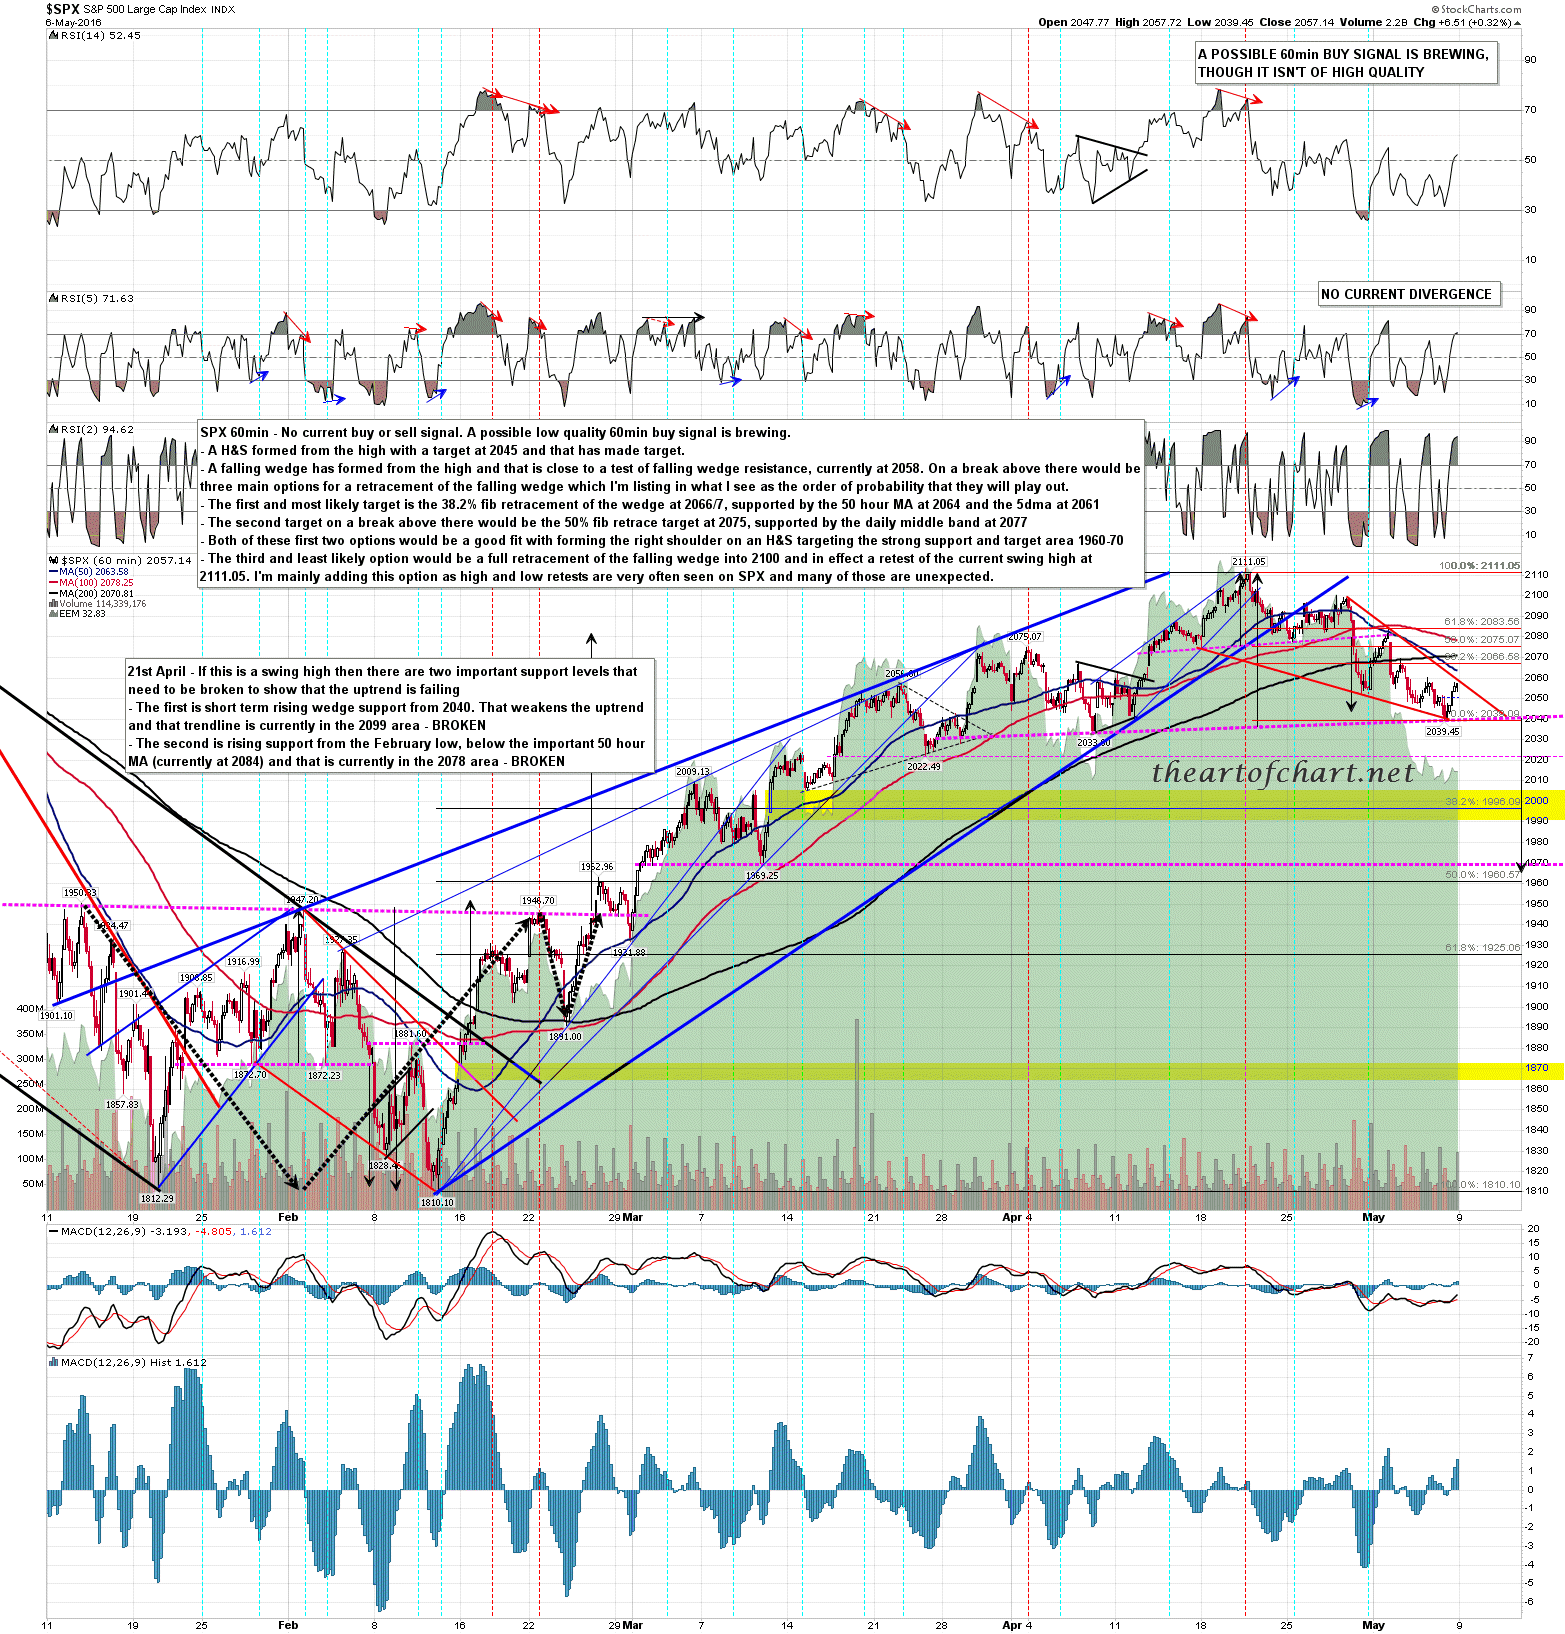
The rally that I was expecting on Thursday morning failed early, and it’s possible that the one that started on Friday afternoon might do the same, but if it doesn’t I am still looking for a right shoulder to form on the same possible H&S pattern that I was looking at on Friday. It’s a decent looking setup and I’ve detailed the three main rally options on the chart below in my order of preference. The third option is a possible retest of the swing high at 2111, and I’d give that option only 20% odds here, mainly because I know that it’s always best to keep the possibility of a retest in mind as an option. SPX 60min chart:
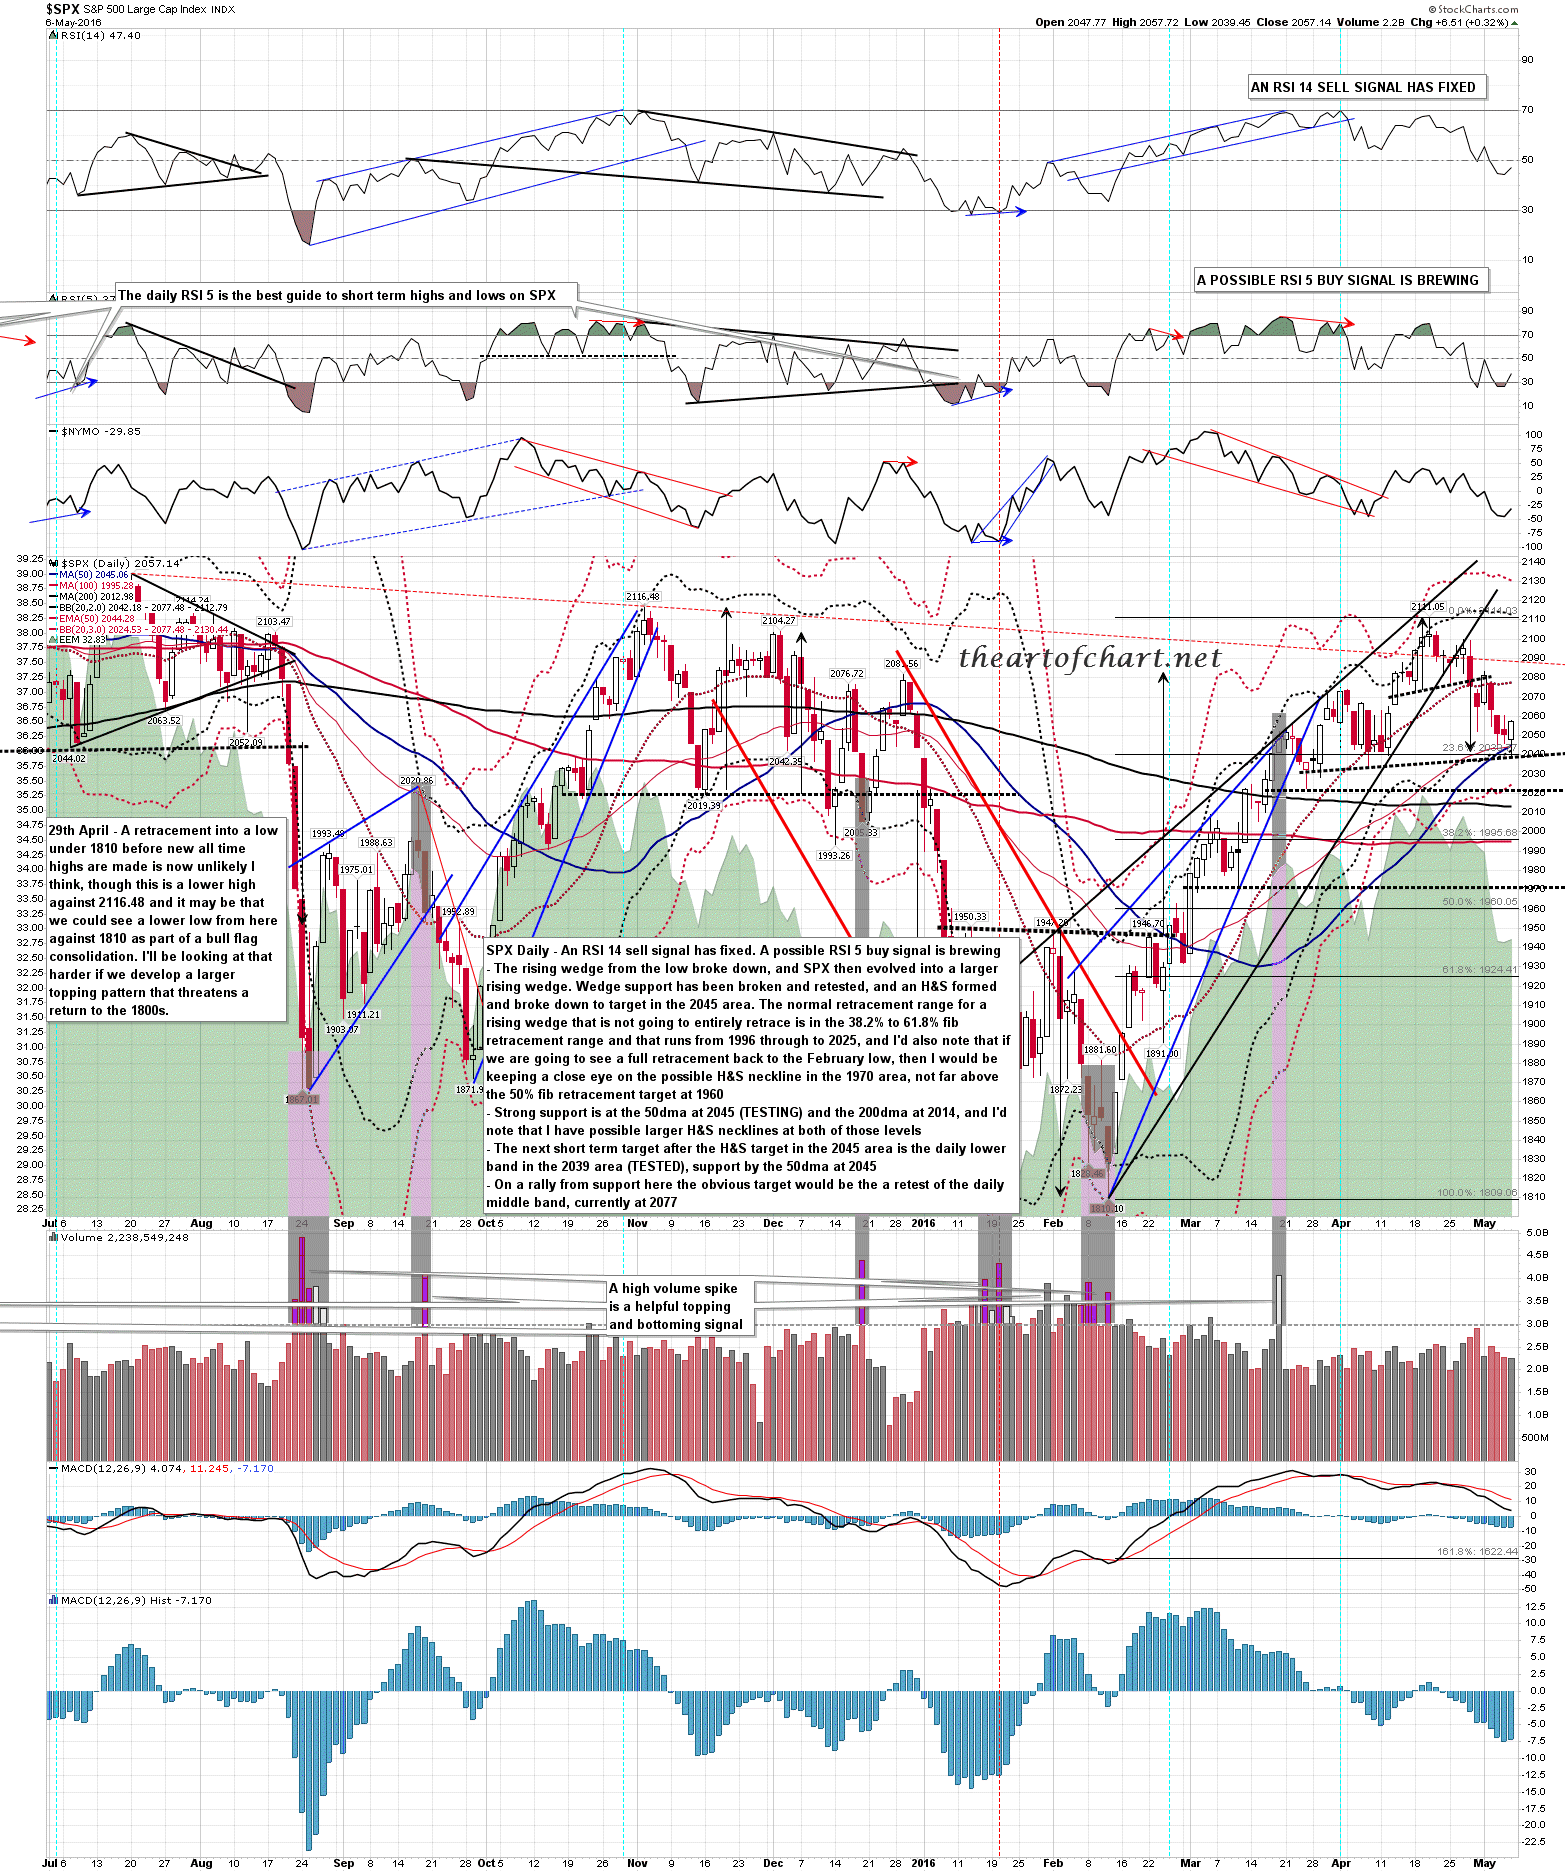
SPX daily chart:
On ES as well as SPX there may be an IHS forming here, so the next step in this rally may of course be a higher low. ES Jun 60min chart:
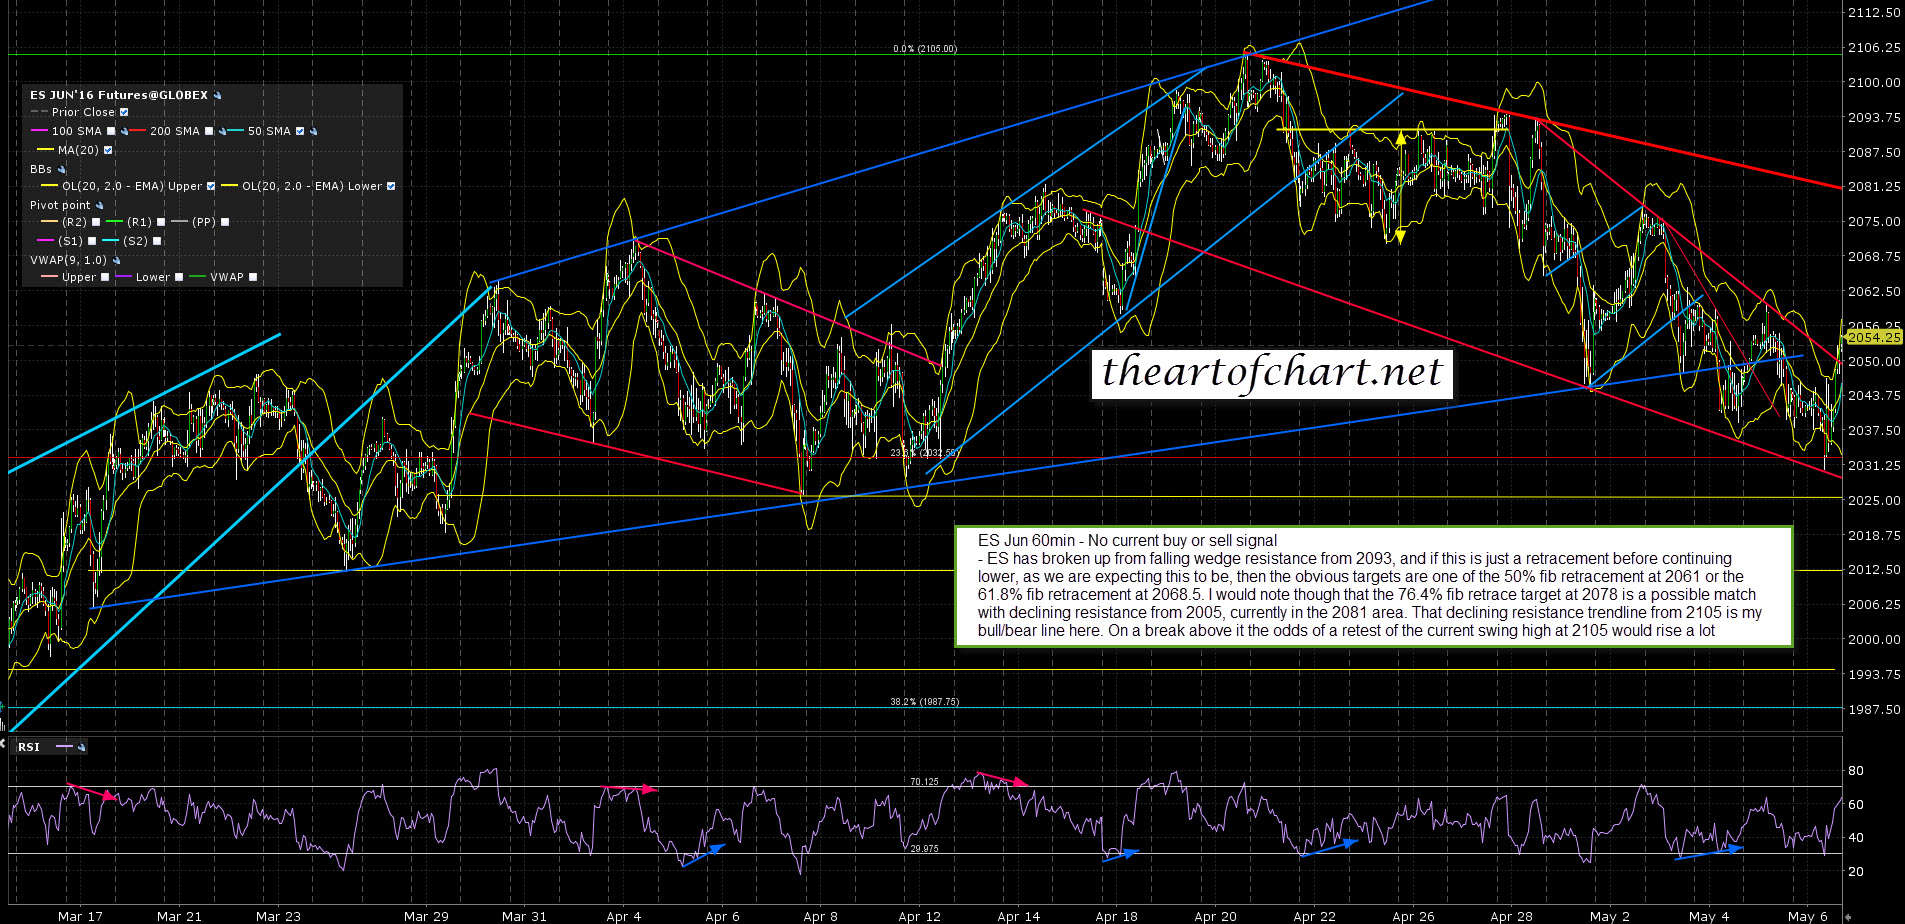
The weekly pivot on ES is at 2054.40 and this is likely to be a key battleground for any rally this week. The key target areas above on SPX are the 2060-6 and 2075-7 areas, and on a break above 2085/6 SPX we would likely be looking for a retest of the current swing high at 2111.05
