
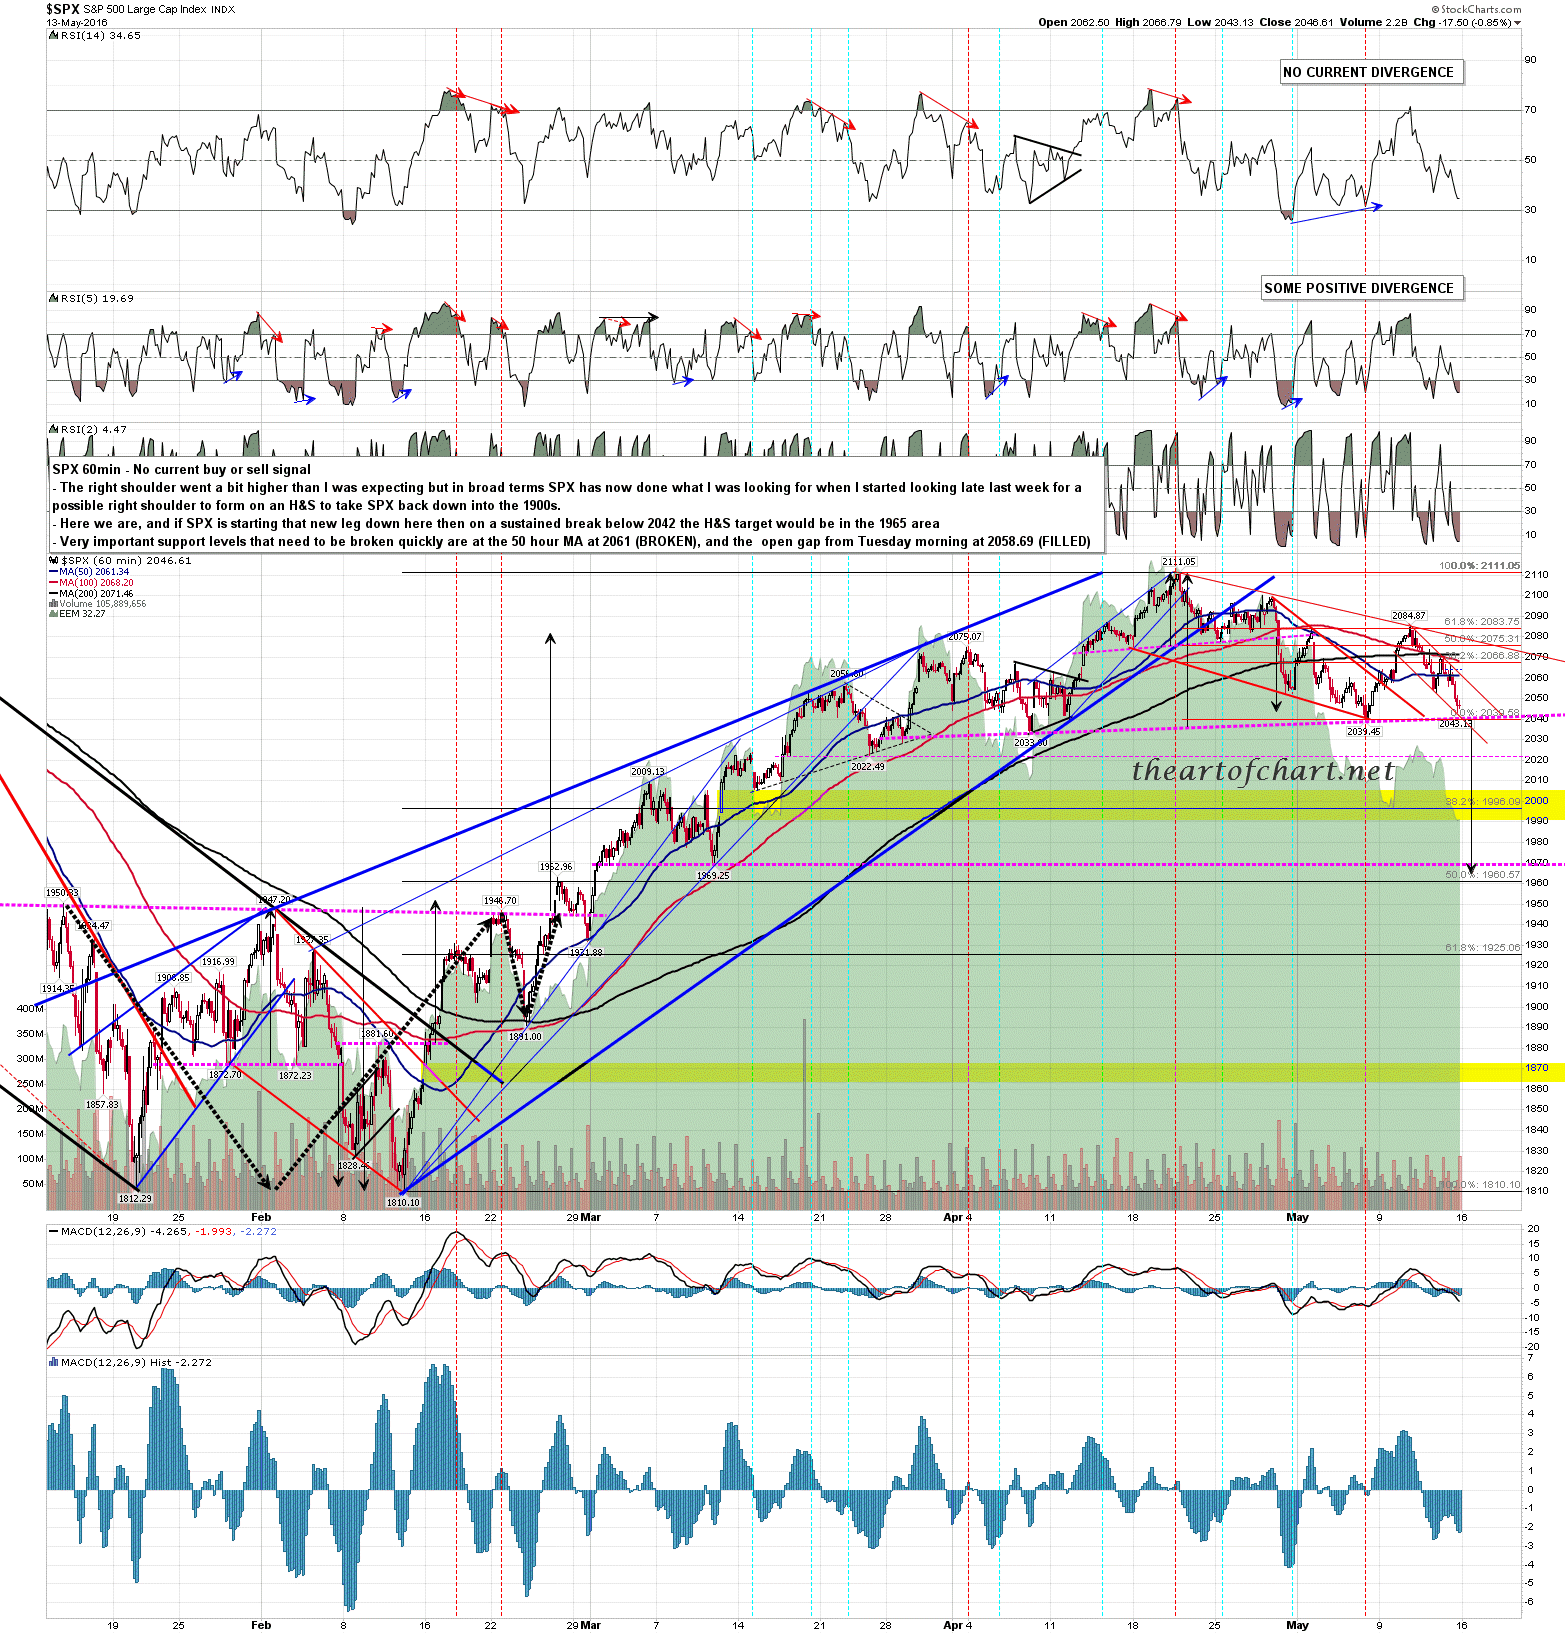
Last week finished pretty much to plan, with SPX starting the test of the H&S neckline and everything going as expected. Obviously that H&S neckline needs to break this week, ideally early in the week and without a huge rally that might put the H&S scenario in doubt. SPX 60min chart:
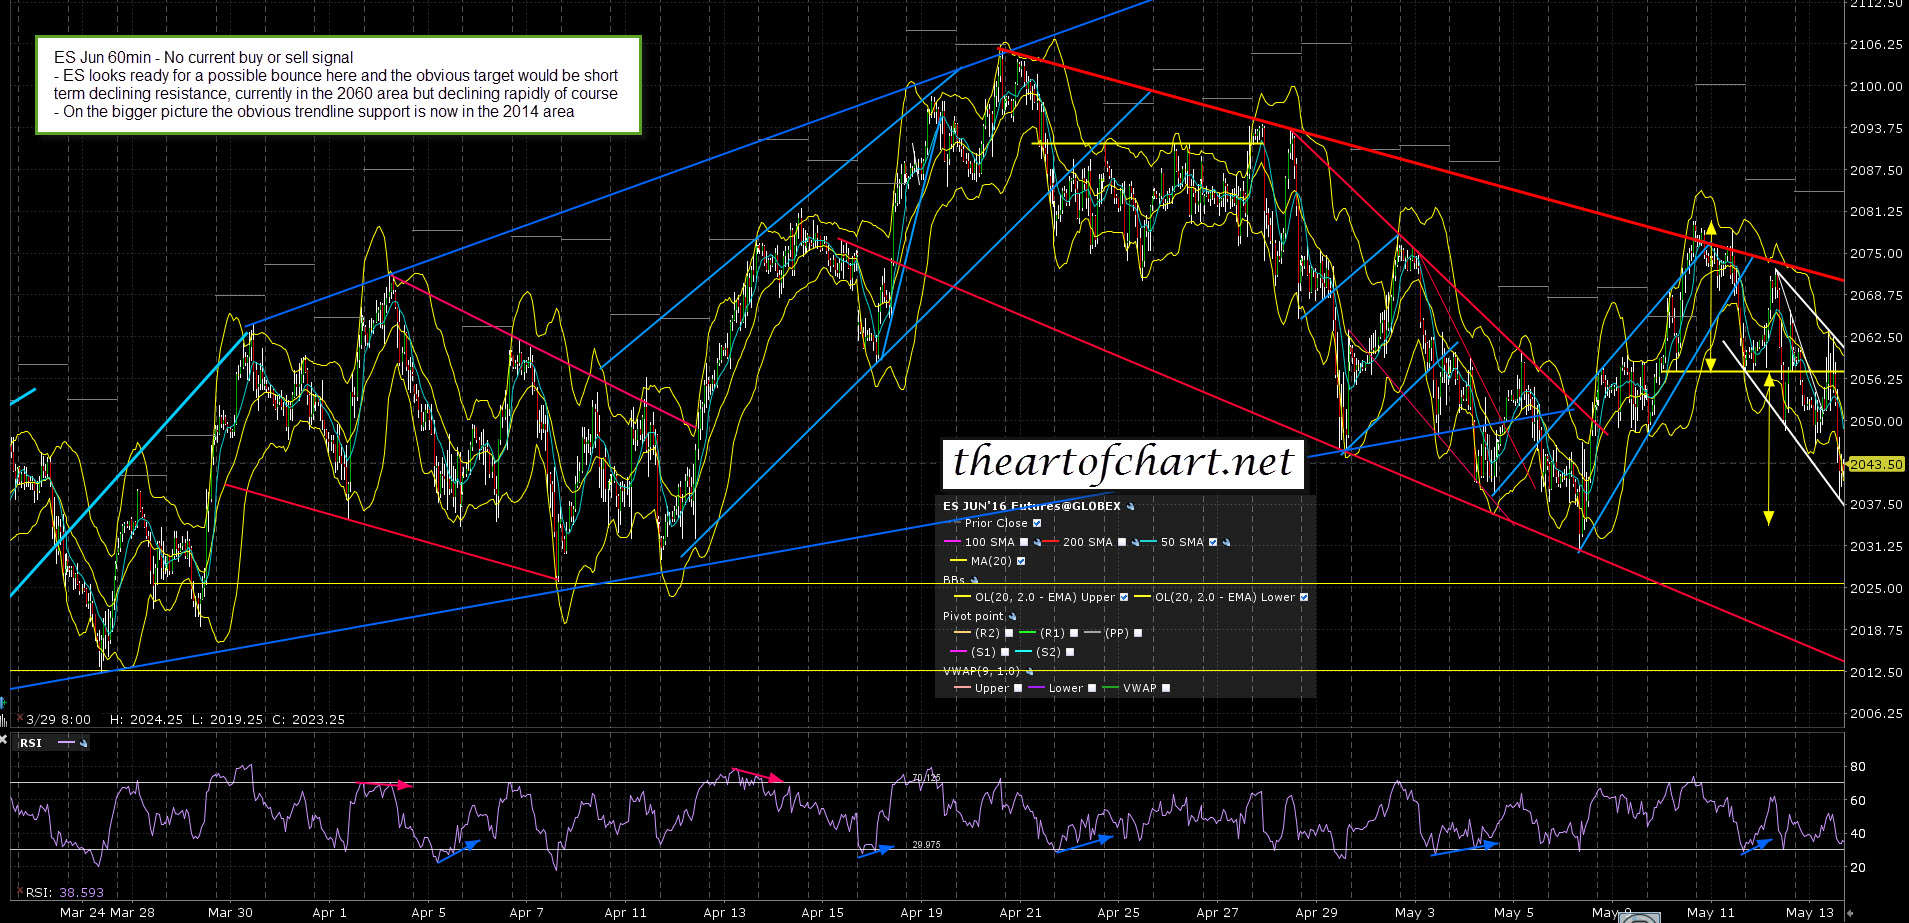
So what would be an acceptable rally that wouldn’t risk compromising the downside scenario? Well the ES weekly pivot is at almost the same level as last week at 2054.1 (approx 2058-60 SPX). Backing up the weekly pivot is declining resistance in the 2055 ES area (approx 2059-61 SPX), and the SPX 50 hour MA at 2061. As long as any rally fails in that strong confluence of resistance levels then we remain firmly on the bear scenario here. ES Jun 60min chart:
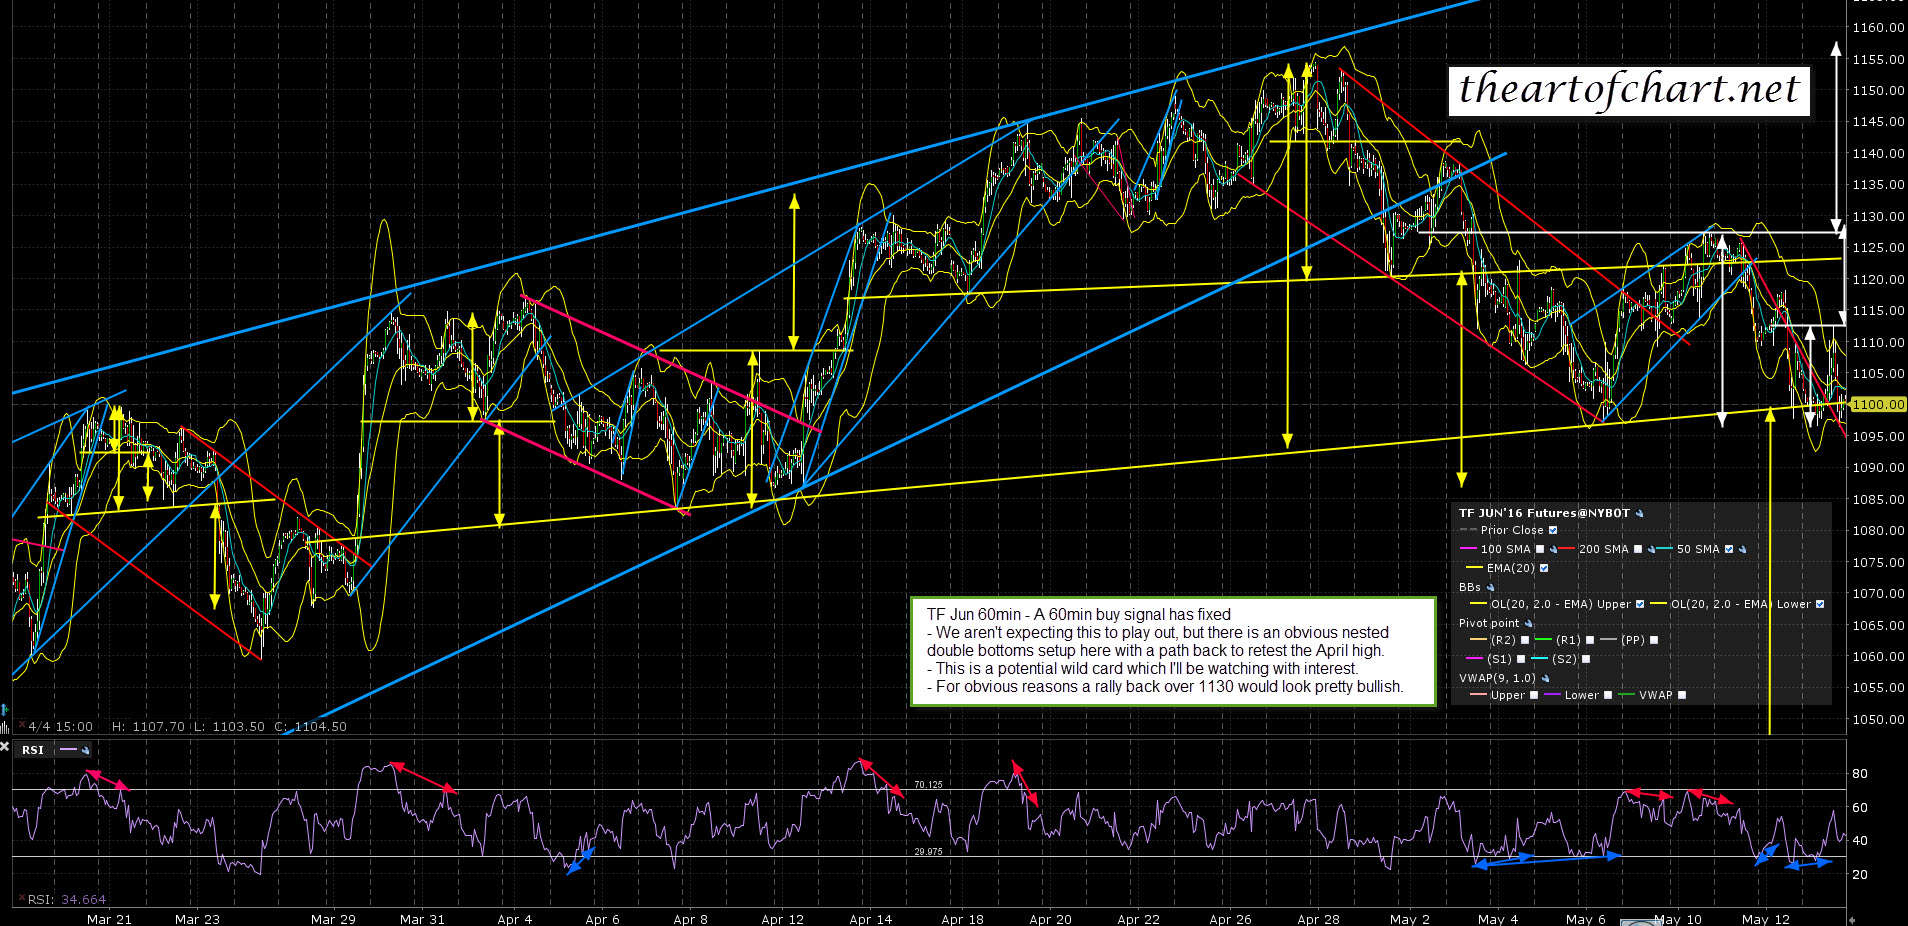
Are there any reasons to look nervously at that resistance area? Well …….. apart from the bears’ obvious history of frequently dropping the ball at awkward moments, there are possible bull setups on both NQ and TF that are warnings to shorts to step back and reconsider if obvious resistance breaks. The stronger setup is on TF where a 60min buy signal has fixed and there is a possible nested double bottoms setup that is showing a possible path back to retest the swing high if bulls can reverse back up hard here. TF Jun 60min chart:
Bulls have their work cut out here though. The first resistance that I’ve talked about today is strong and I’m expecting it to hold. Next resistance is ten handles higher at the ES monthly pivot at 2063.80 (2068-70 SPX area) and then just above that is the daily middle band at 2074 SPX. Those are strong levels too. Bulls need to break above all of this to be taken really seriously this week. That said, today is a cycle trend day, so it’s way too early to dismiss bull prospects altogether. We’ll see what happens at the first and main resistance test, which has started as I’ve been writing.
