
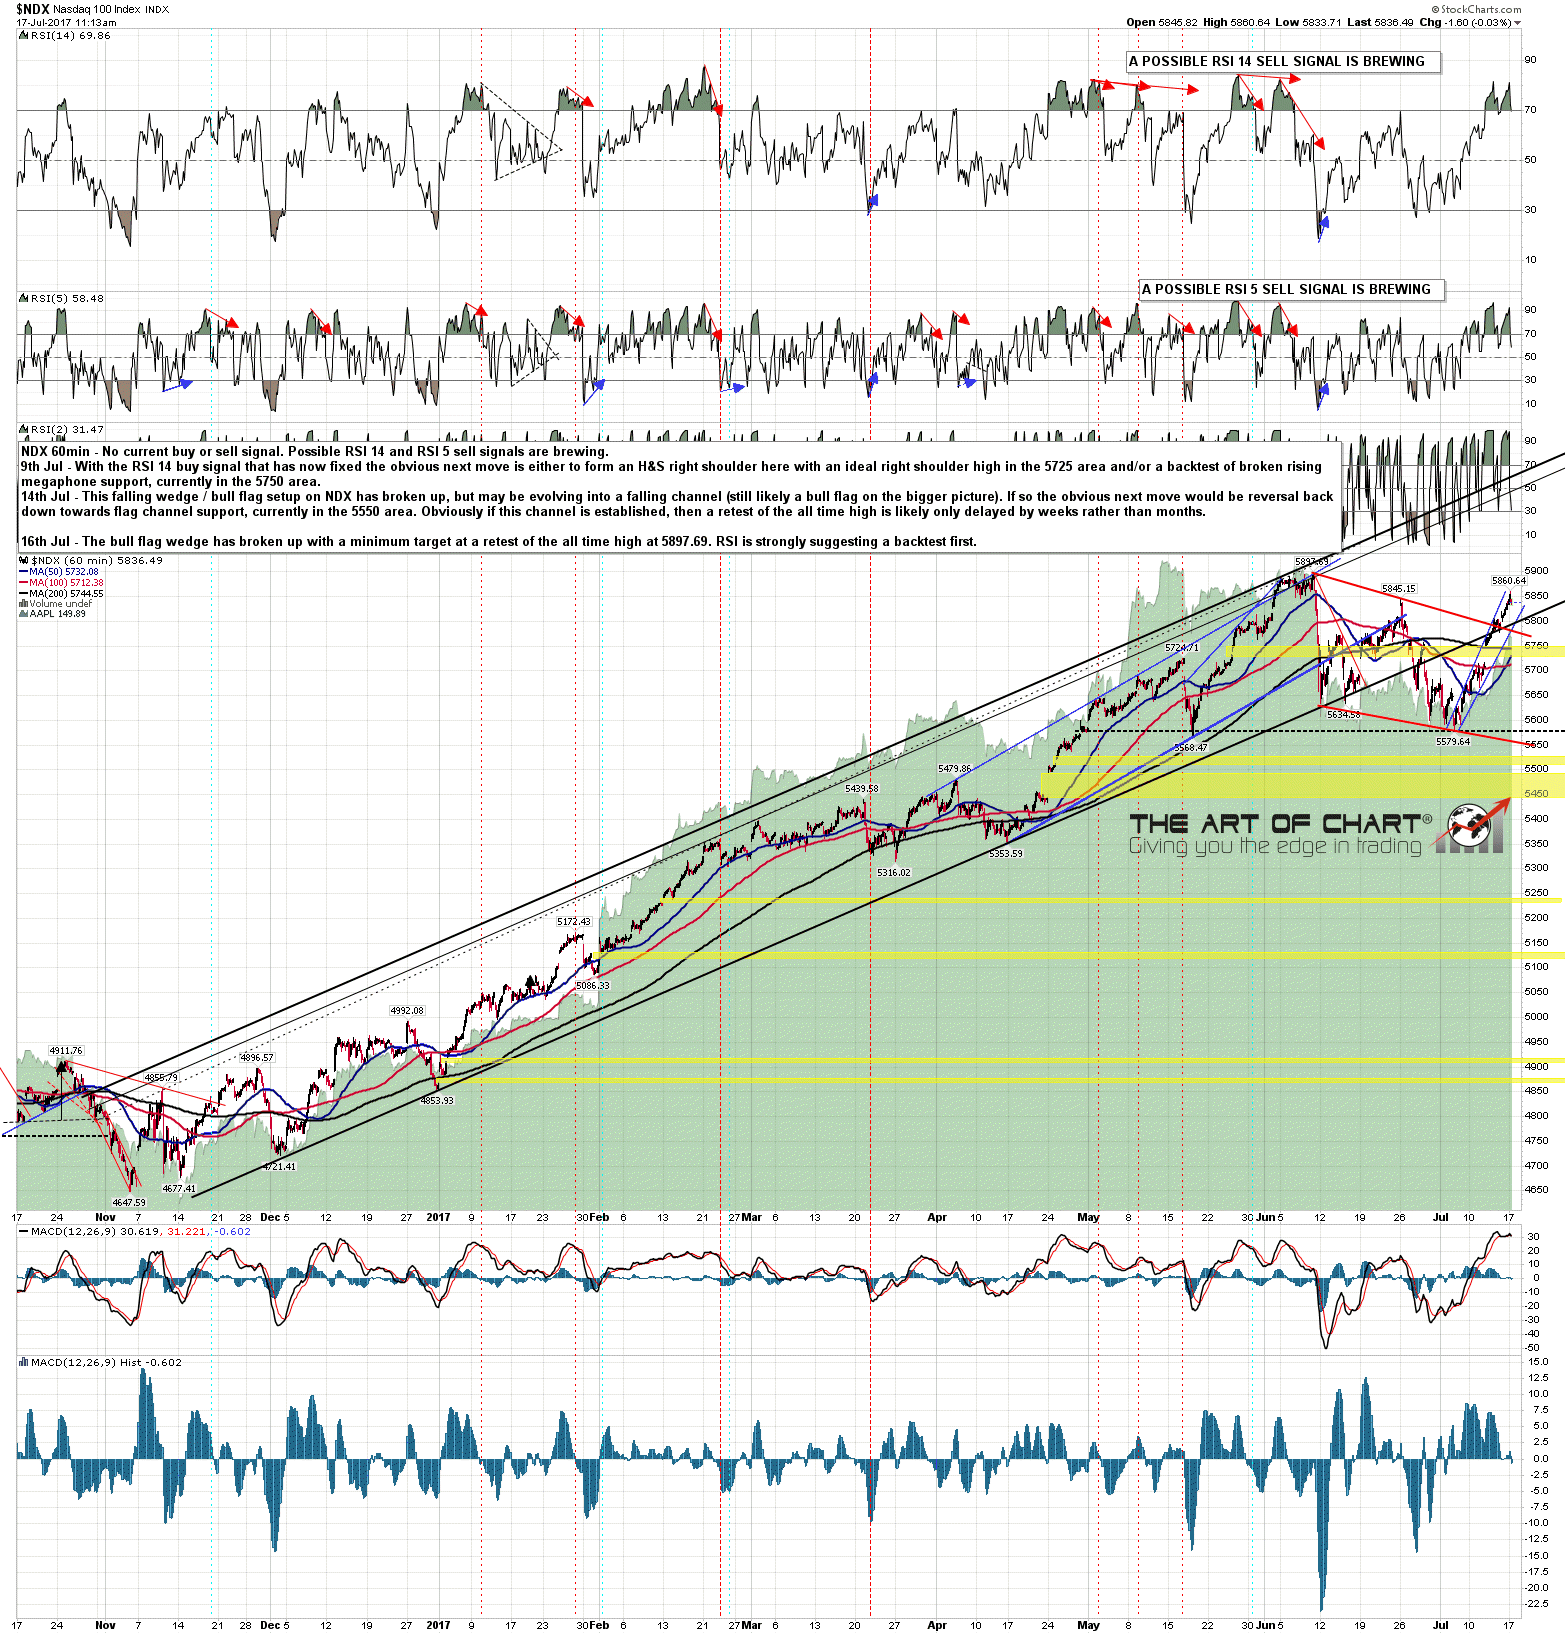
NDX has made it over halfway from the break of the flag to the retest of the all time high, and I am treating that retest as the 70% likelihood option here. On the way though there is a lot of short term negative divergence that will likely deliver a retracement, maybe today but otherwise tomorrow. On NDX that may well require a retest of the short term high first. NDX 60min chart:
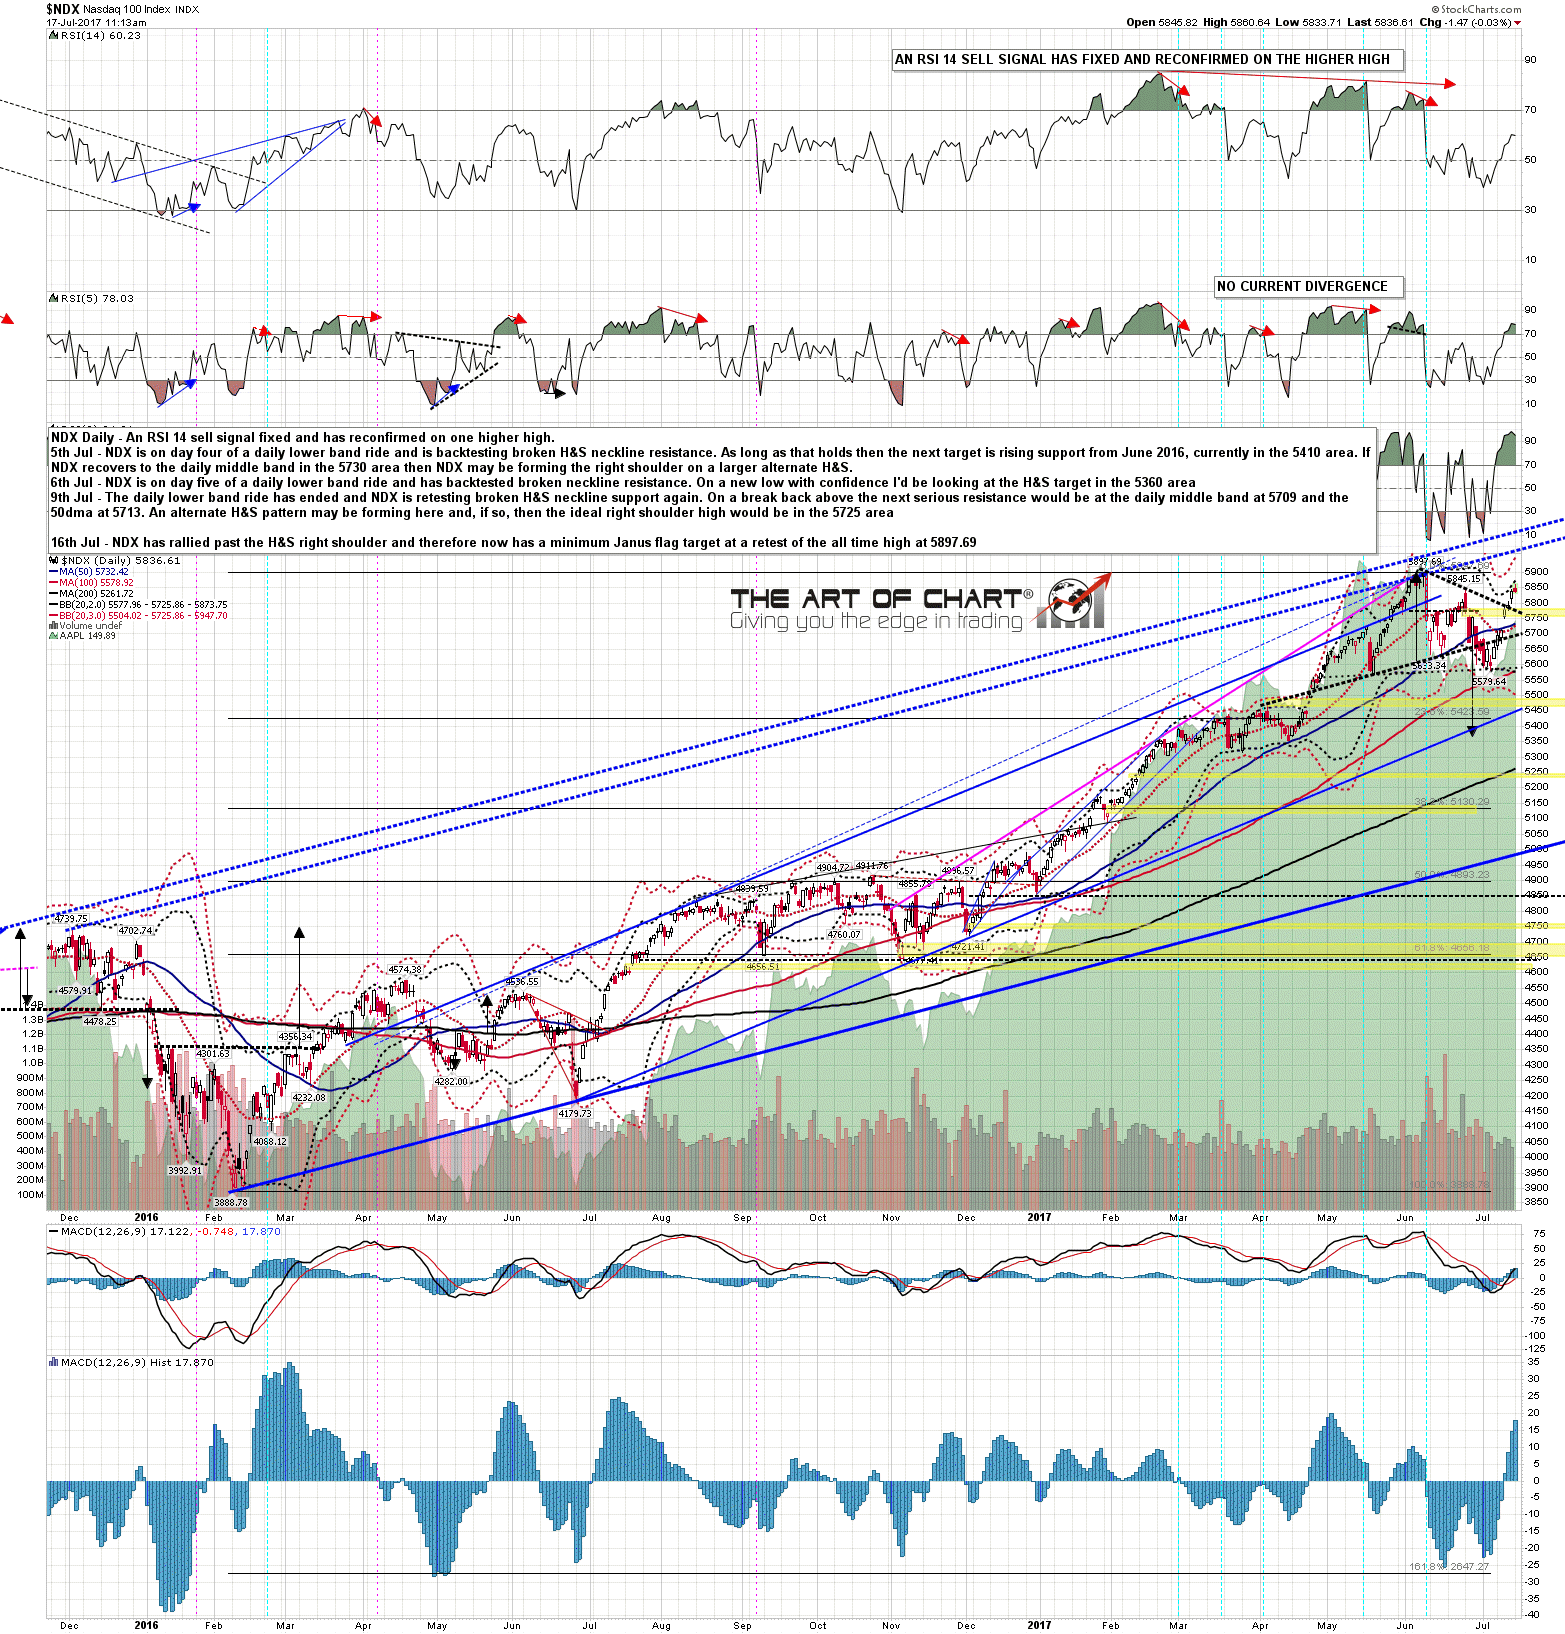
NDX has broken back above the H&S right shoulder so as well as the flag channel target back at a retest of the all time high, there is also a failed topping pattern / Janus flag target there, also at that retest. NDX daily chart:
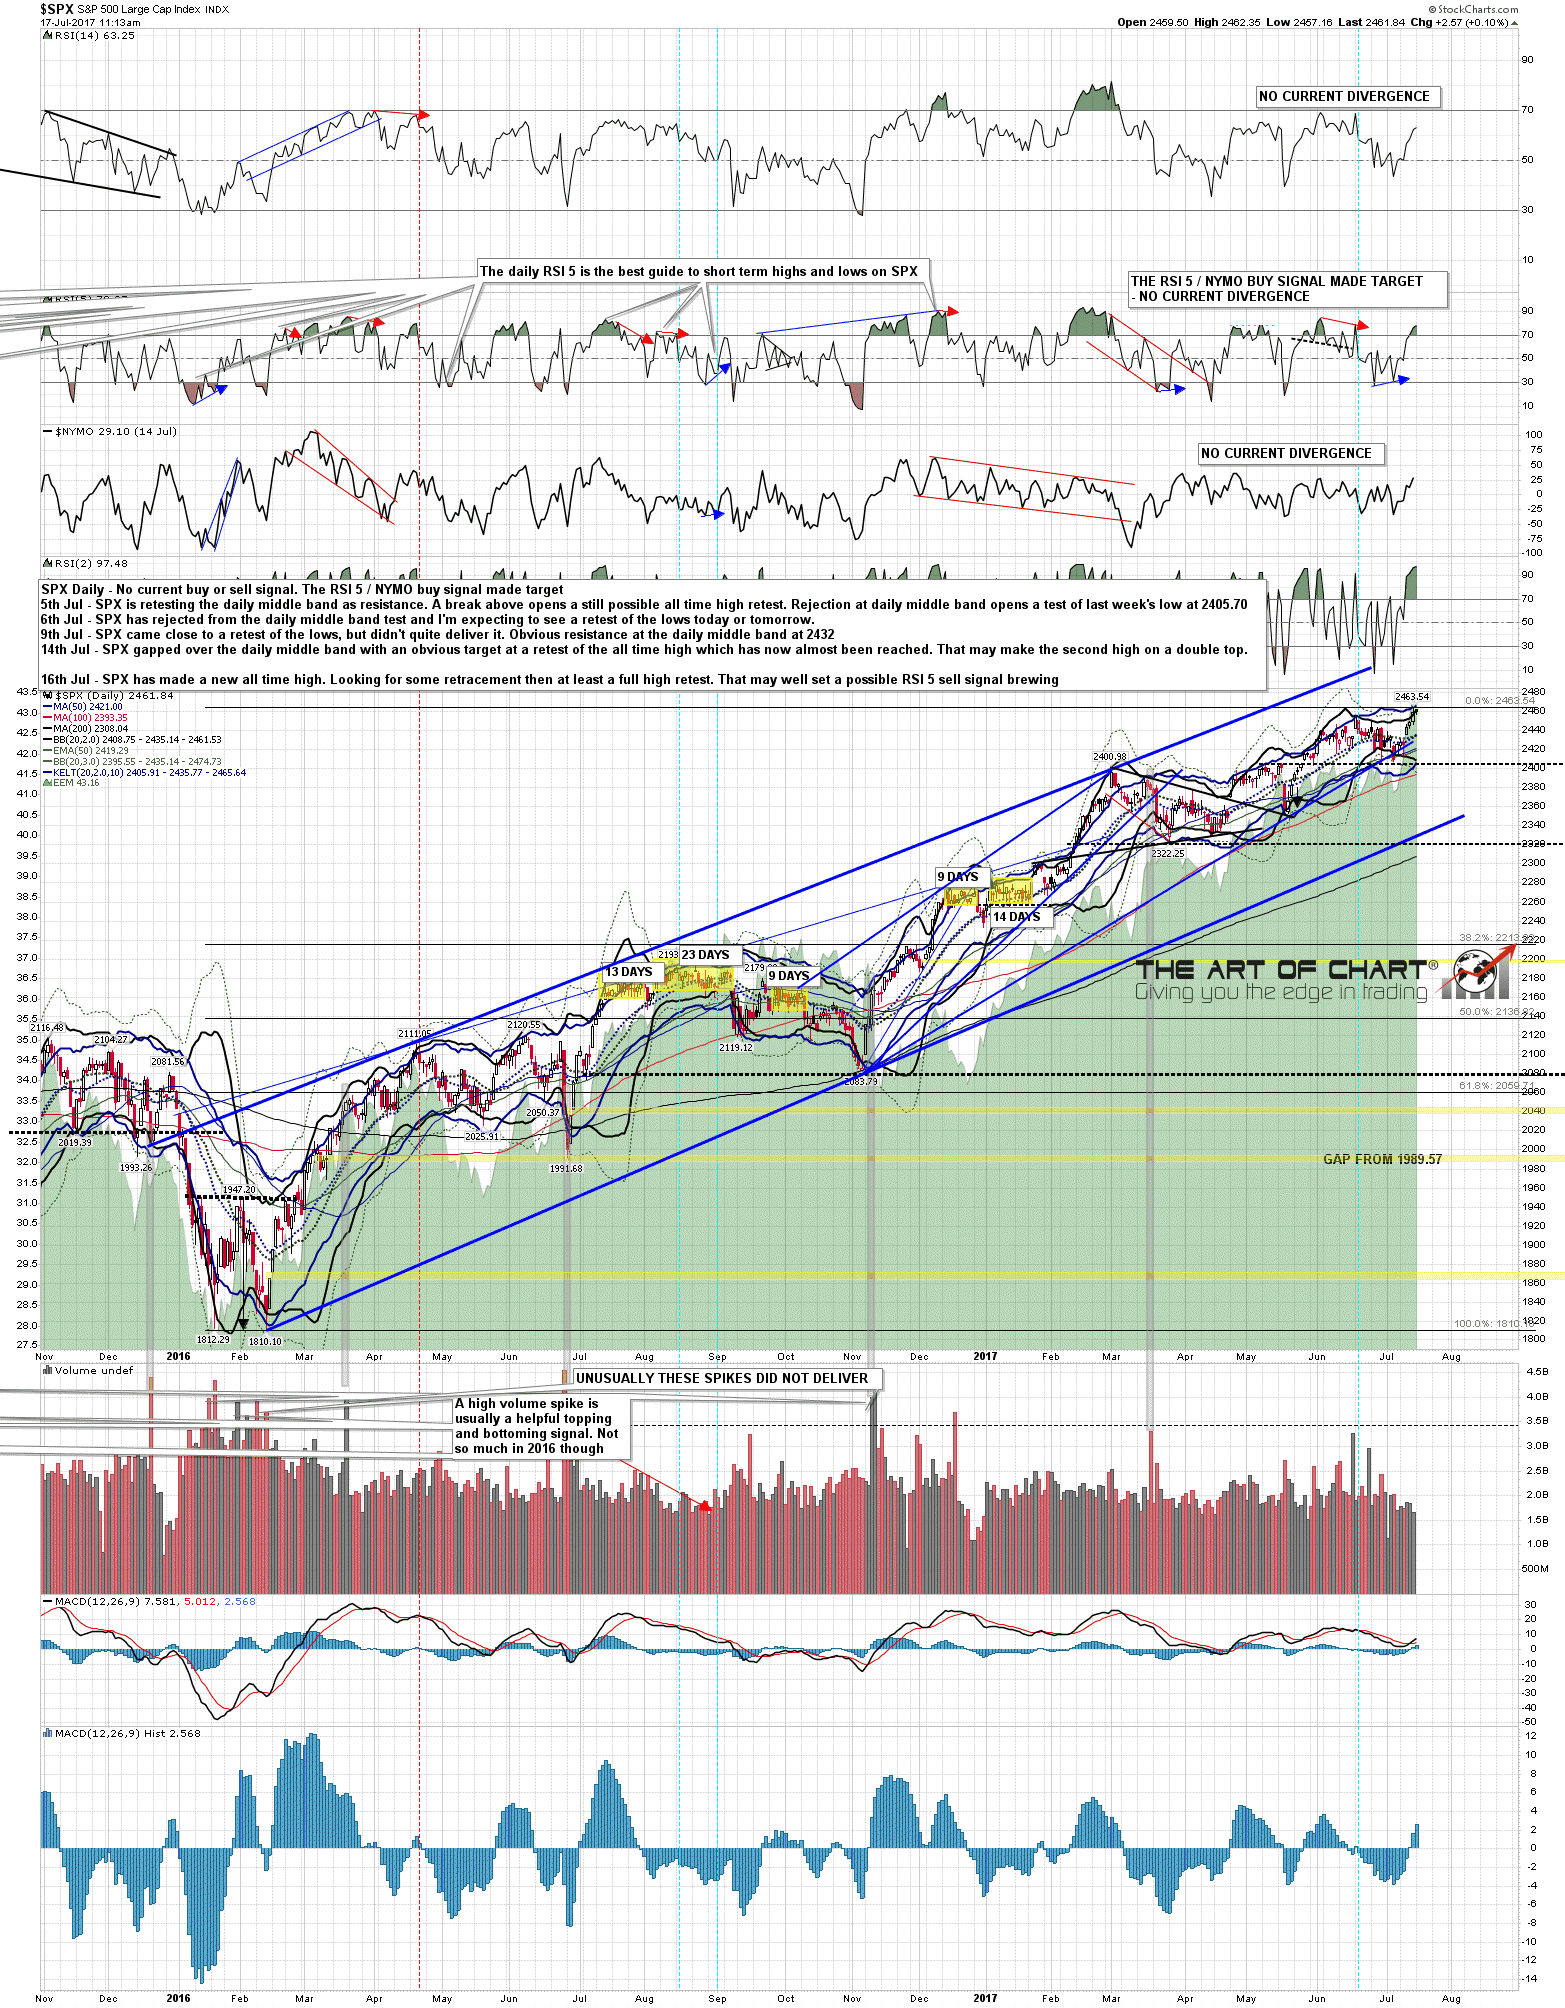
Stan and I are thinking that we see a retracement from this area, then another leg up that at least retest’s Friday’s high before this move can finish. We are still leaning overall towards a resolution into a bearish expansion here, though we could obviously see the still looking less likely bullish expansion instead and that needs to be borne in mind. Either way, this retracement, if seen, should set up a decent buyable dip. SPX daily chart:
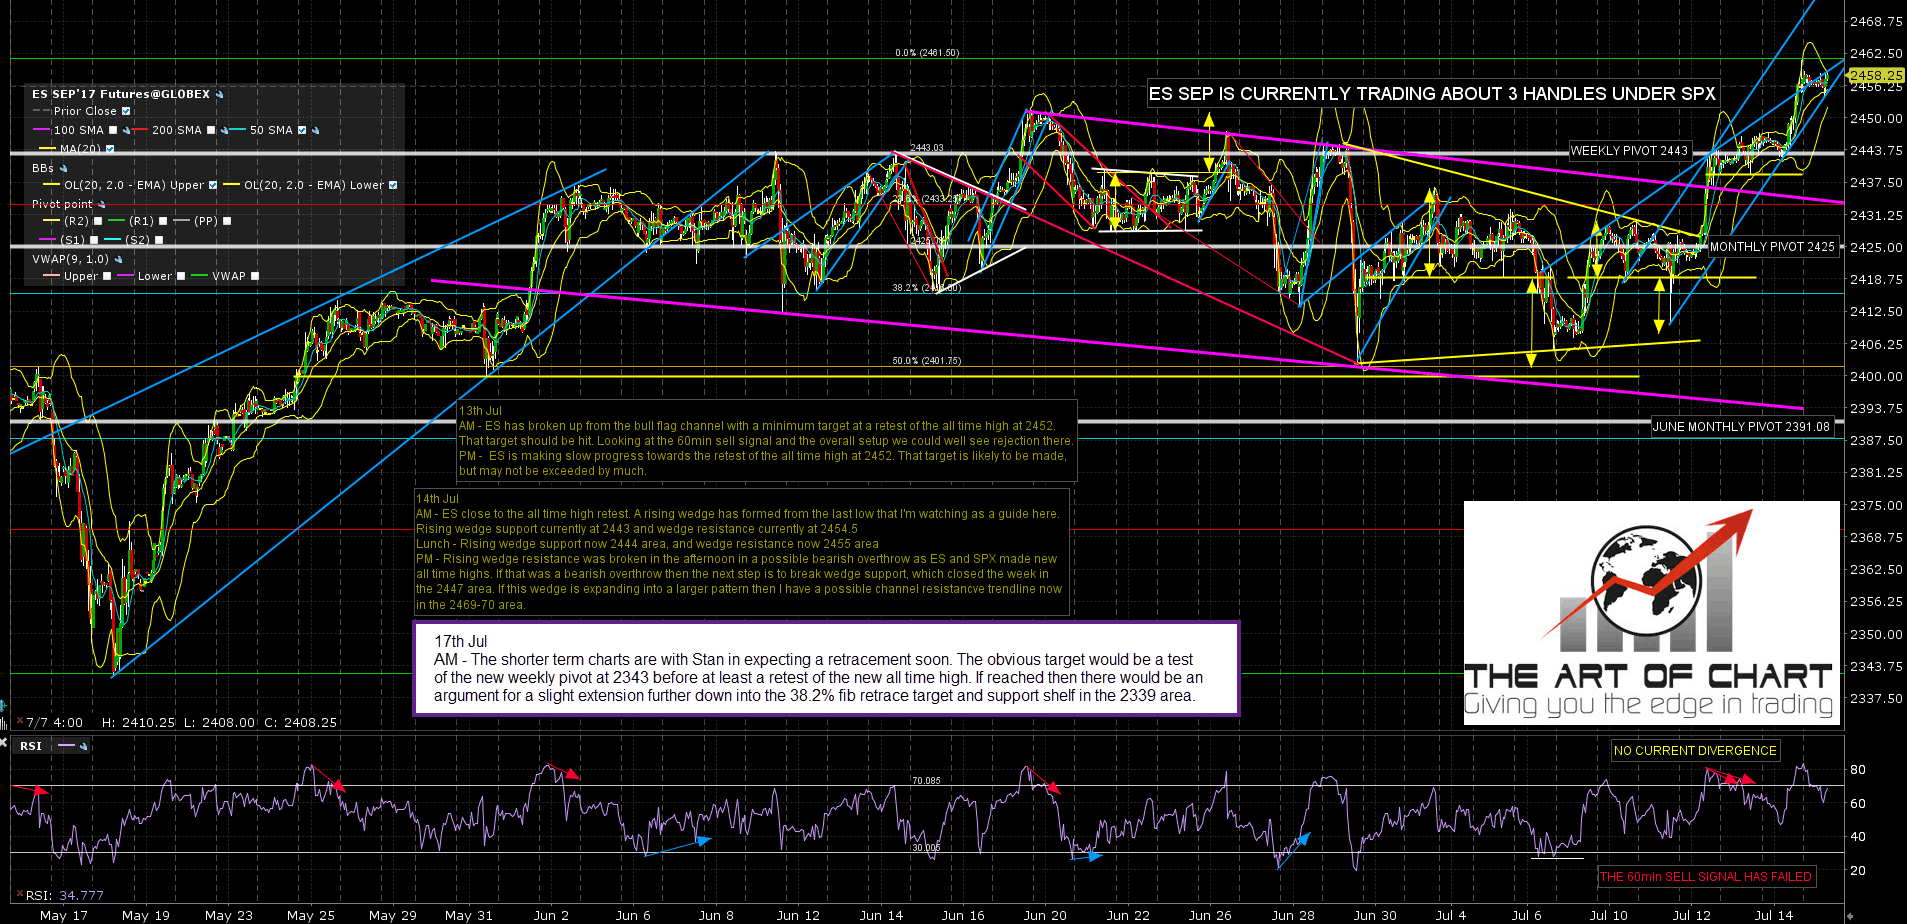
The ES, NQ and TF futures charts below were done before the RTH open for Daily Video Service subscribers at theartofchart.net. If you are interested in trying our services a 30 day free trial is available here.
So where might this retracement go? Well the usual target would be a test of the new weekly pivot on ES, which is at 2443. If the current short term high area holds then an possible extension beyond into the 2439 area to hit the 38.2% fib retrace target and the established support shelf there would be a real possibility. We wouldn’t be expecting any sustained break below the weekly pivot. ES Sep 60min chart:
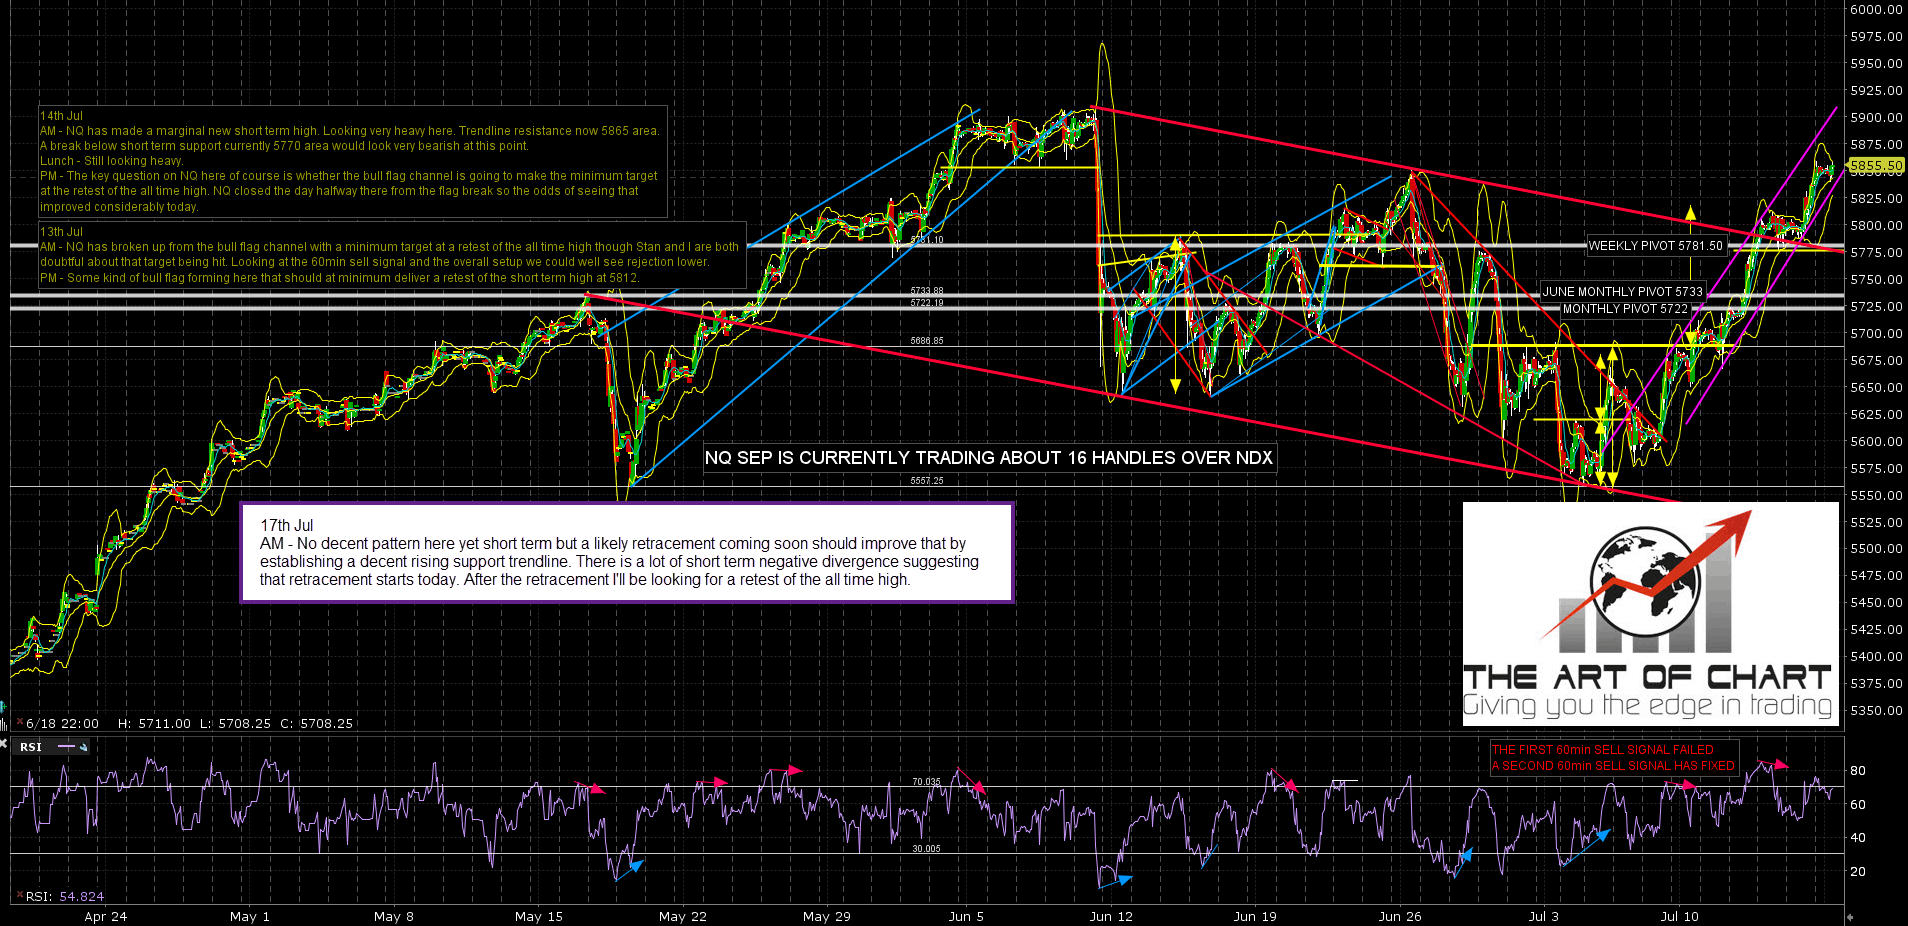
The new weekly pivot on NQ is at 5781.50 and that isn’t tested as reliably every week, but is on the cards with the decent quality negative divergence on both the NDX and NQ hourly charts. NQ Sep 60min chart:
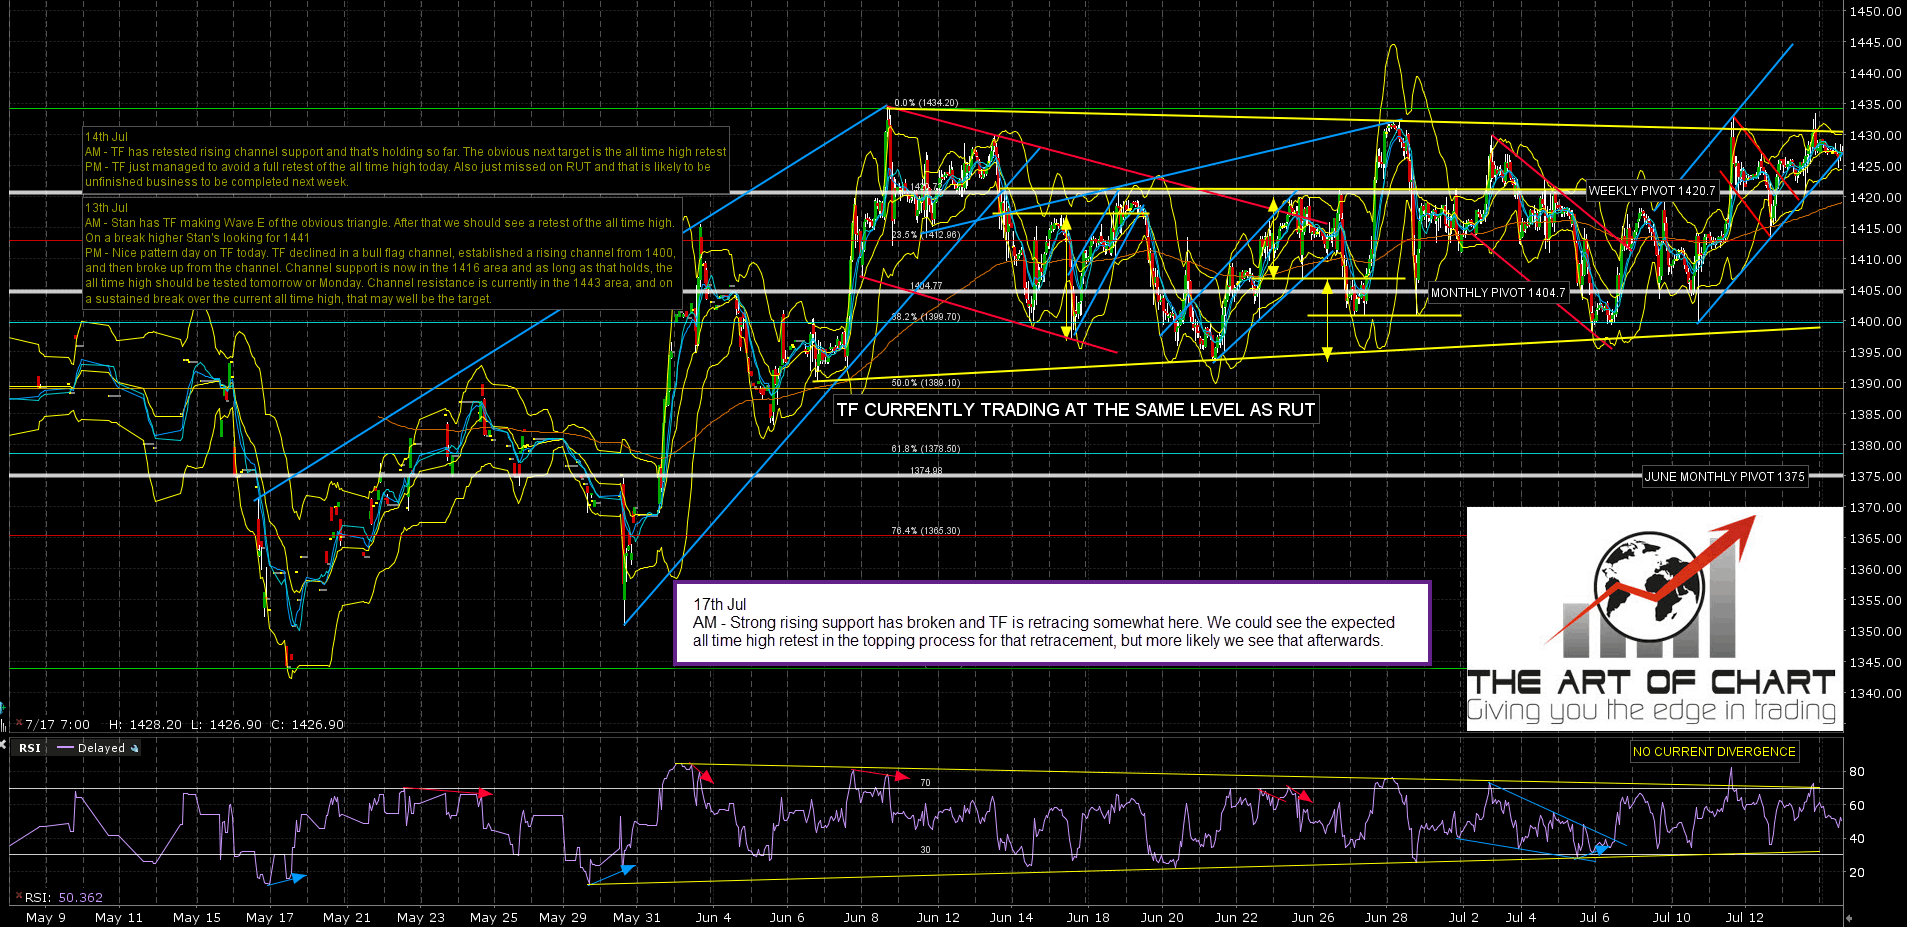
I wrote on the TF chart earlier that the all time high retest there might need to wait until after this likely retracement but TF just managed that at the high this morning,so of these three only NDX/NQ has an outstanding likely all time high retest still not completed. TF Sep 60min chart:
The short term high may be in and the retracement may be in progress already. If so the retracement has started off slow and choppy and may continue that way as well of course.
Stan and I are doing the fourth webinar in our ‘Managing Risk In Trading’ series at theartofchart.net an hour after the close on Thursday, and if you would like to attend then you can register for that on our July Free Webinars page. This webinar is dealing with Stop Systems and Trade Repair. I would also note that this week’s edition of The Weekly Call is posted and that the model portfolio there is up 170% in the seven months to June 23rd, obviously well on course to make our target minimum 200% return over the first year. As and when that target is reached we’re thinking of making the strategy there a bit less conservative. That’s a free weekly service and if you trade futures I’d suggest adding it to your reading list.
