
The U.S. Homebuilders ETF (XHB) is in bear market territory…down 24.68% from its peak on January 24 of this year.
On a year-to-date percentages gained/lost basis, it has drastically underperformed the 9 U.S. Major Sectors, as shown on the graph below.
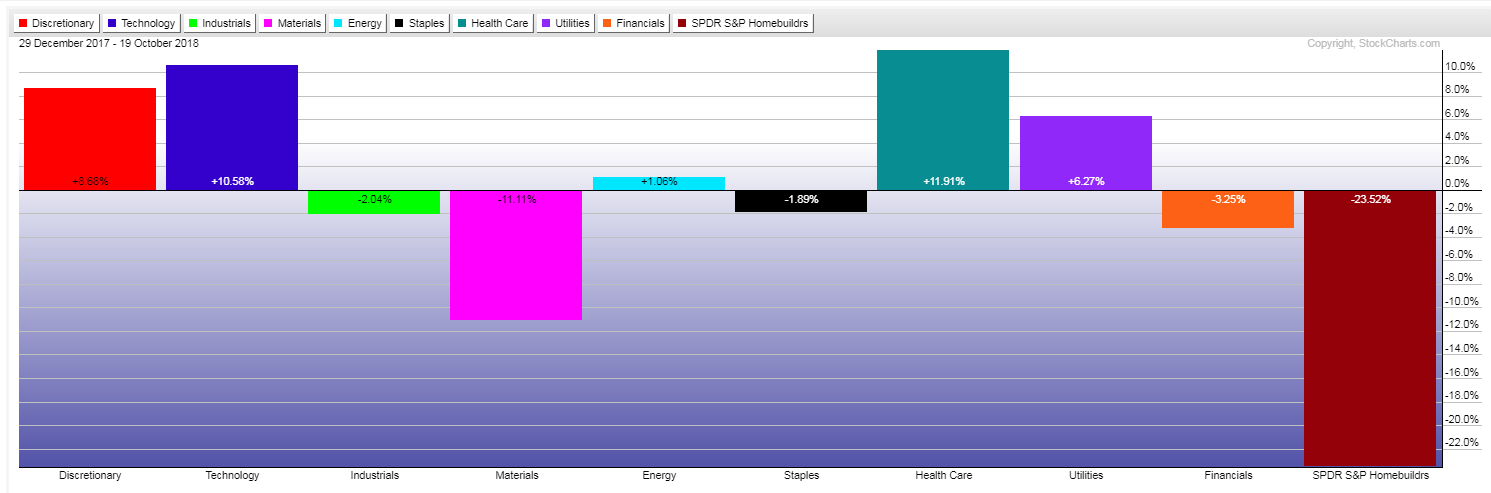 |
| Year-to-date % Gained/Lost graph of 9 U.S. Major Sectors + Homebuilders |
As shown on the first monthly chart, the XHB is nearing a long-term 38.2% Fibonacci retracement level at 32.23, representing a first major support level. Second major support level (50% Fib retracement) sits at 27.60 on this timeframe.
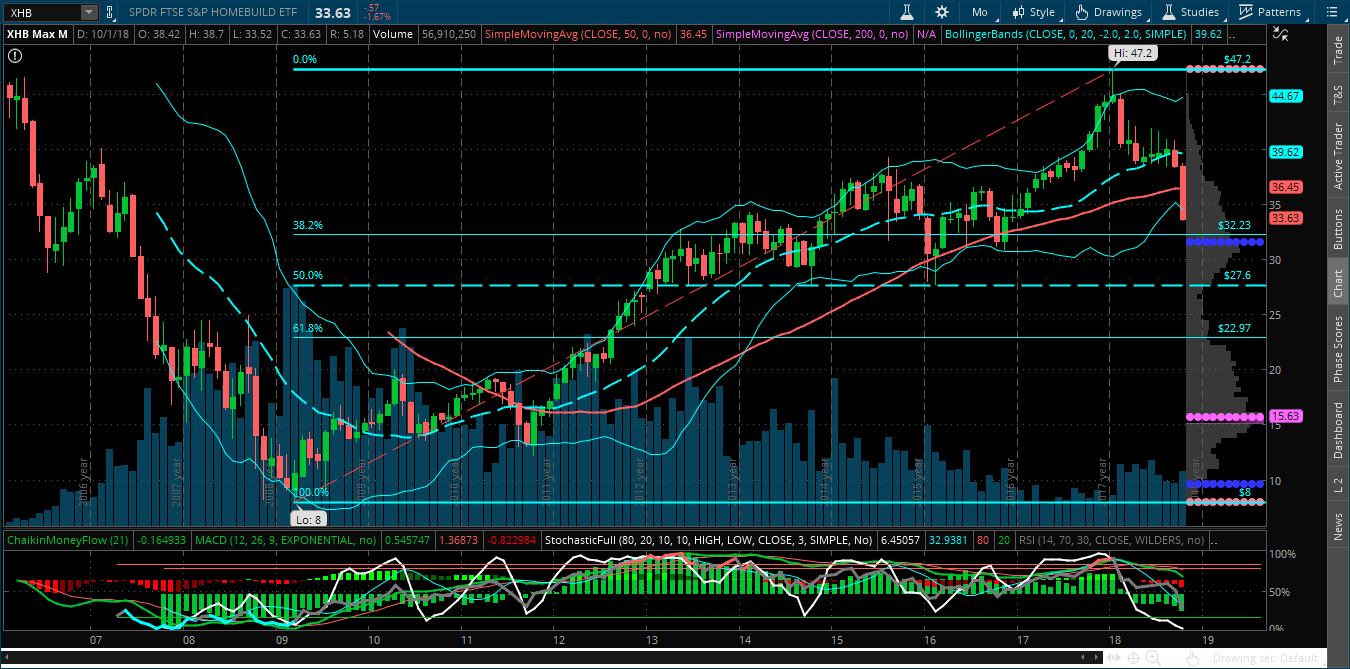 |
| XHB Monthly |
The second monthly chart shows that the XHB has dropped beneath a long-term Fibonacci channel on downside accelerating momentum (MOM) and rate-of-change (ROC).
In fact, the MOM and ROC are both at low levels last seen at the height of the 2008/09 financial crisis…which makes me wonder whether the housing market is plagued with another, as yet unrevealed, systemic risk factor of some kind, and whether it will spread to the rest of the U.S. equity markets.
Time will tell. Keep an eye on the MOM and ROC indicators, as well as on other critical factors that I described in my recent posts here and here, for potential clues in gauging overall market strength/weakness in the short/medium term.
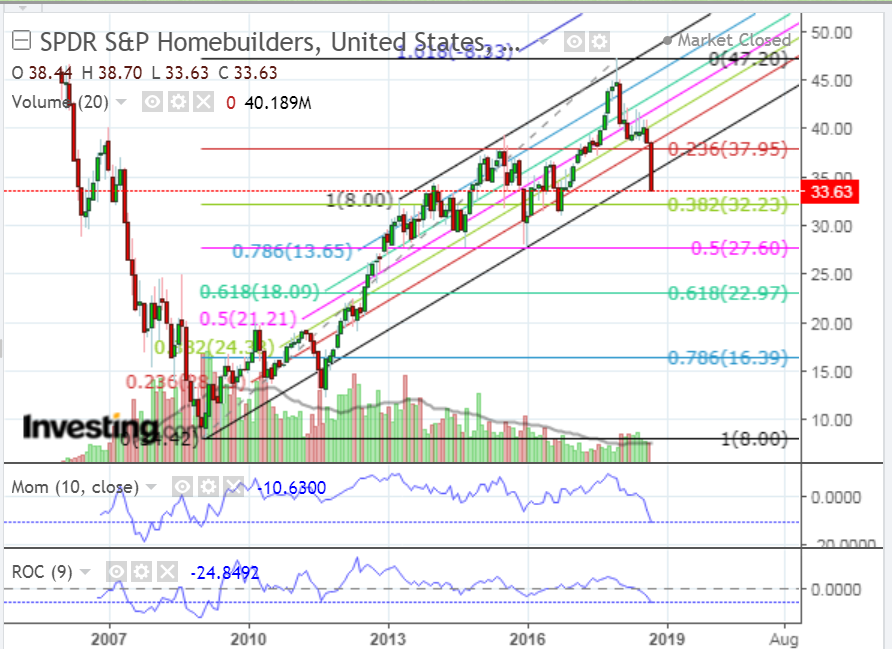 |
| XHB Monthly |
In that regard, the following monthly ratio chart of the SPX:VIX ratio shows that price remains below the 150 Bull/Bear Line-in-the-Sand level on downside accelerating momentum (MOM) — at a level below the one made during the height of the 2008/09 financial crisis — indicating an unusually high level of rapidly changing volatility in the SPX…another warning hinting of further equity weakness ahead.
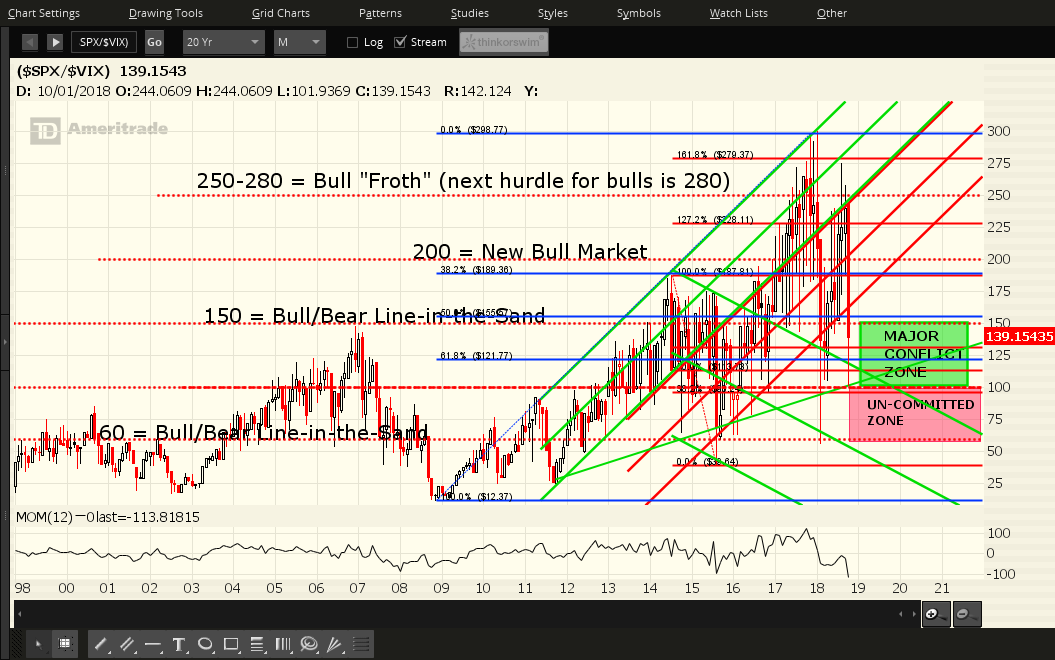 |
| SPX:VIX Ratio Monthly |
