
SPX closed on the middle bollinger band on the daily chart on Friday, with the body of the candle above the band. That looks cautiously bullish if SPX can break up from the band today, with ideally no part of the candle touching the middle bollinger band:

My main retracement target is still tantalizingly close however, with channel support on the rising channel from the June low in the 1415 area today, with the 50 DMA just below at 1412:

Are we going to see more downside? Well recent days on TRAN look very much like bottoming action on positive RSI divergence. I've widened the view on the TRAN chart to show the last three strong directional moves there and at this stage on the last three a reversal was in progress. If this is a W bottom on TRAN then the target is the 5130 area on a break over 5003.28:

On the TLT chart there is now a little double-top at falling wedge resistance and there is a nice setup for a reversal down there. That setup is only complete on a break below the short term rising support trendline however so we'll see whether that happens today. For the moment TLT is pinned between declining resistance at 125 and rising support at 124:

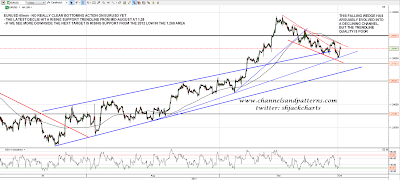
EURUSD has broken back below broken rising wedge resistance to test rising support from mid-August at 1.28. No clear bottoming action there yet and we could see more downside. If we do then rising support from the 2012 low is in the 1.269 area:
I was saying the Friday before last that ideally we would see a hit of the rising channel support trendline on SPX at the start of October where it intersected the May high at 1415. If we're going to see that happen, it would be today or tomorrow. Stock Trader's Almanac say that on the first day of October Dow has been down 5 of the last 7 so the daily stats are bearish.
