I was looking at CME GC Gold Futures, August 2025 expiry, 2 weeks down and reached a price area that my model considers oversold:

Slope initially began as a blog, so this is where most of the website’s content resides. Here we have tens of thousands of posts dating back over a decade. These are listed in reverse chronological order. Click on any category icon below to see posts tagged with that particular subject, or click on a word in the category cloud on the right side of the screen for more specific choices.
I was looking at CME GC Gold Futures, August 2025 expiry, 2 weeks down and reached a price area that my model considers oversold:
Apologies, in my previous post (today), I forgot to add a chart for Crude Oil LONG.
Since this scenario is panning out as I write (CL Futures Nymex expiry Aug2025 touched below 68 an hour ago), I think it may be helpful to briefly discuss where this pullback can go.
Here below is the LONG WEEKLY model for CL futures, front month (Aug25).
On the left side, the price model: you can see Crude Oil has already reached the WEEKLY OVERSOLD area! (totally contradicting what I said today, i.e. probably a small pullback).
Probability of reversal in the price support zone below 68 is around 72%, quite high.
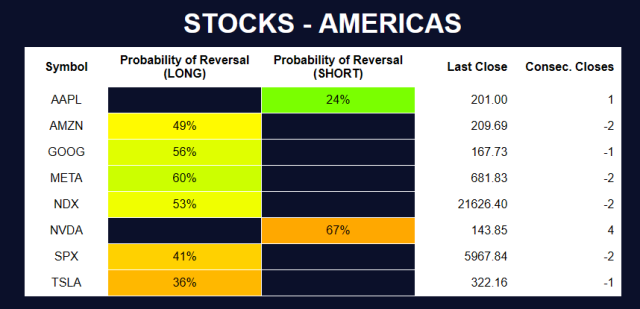
(more…)Here are the WEEKLY HEAT MAPS updated as of last Friday’s close: NVDA is the only stock overbought, Crude Oil is also very overbought but the Iran situation is a factor in that, so it could go higher.
Broadly speaking 50% prob. of reversal is where a transition starts to happen, from neutral to oversold or from neutral to overbought, however >50% is when the probability of reversal becomes good, the chance of a sudden reversal rises.
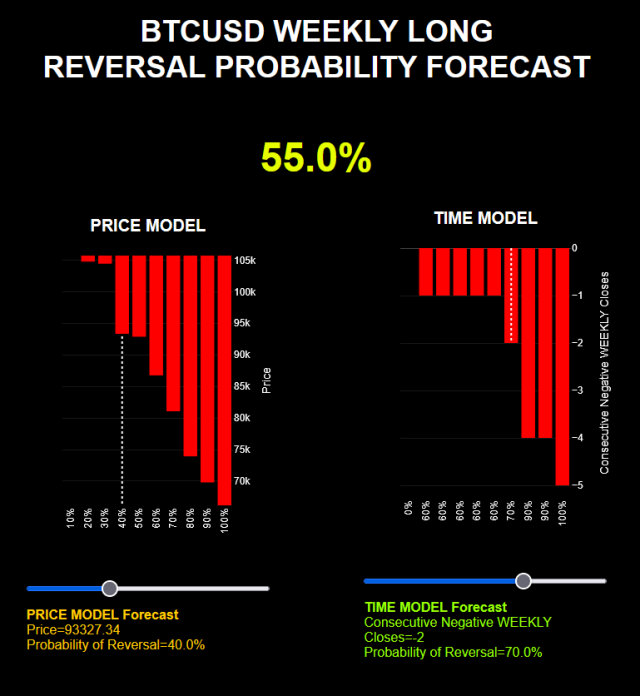
Here is a quick WEEKLY outlook for BTCUSD spot: currently mildly oversold, 2 weeks down.
The time model to the right shows that usually BTCUSD does not pull back for more than 4 weeks, but there is not many events in history where BTCUSD rallies after 2 weeks up, it’s rare.
The point from where it did rally, in the past, when this exact pattern was encountered, is after 4 weeks down.
So this means BTCUSD may fall for another 2 weeks before reversing and going higher.
If you want to get direct access to these tools, you can use this link.
Hello everyone — after a bit of a hiatus, I’m back. I’ve been busy behind the scenes building a few new tools that I hope you’ll find useful in your trading.
Below is a small table showcasing three markets I’m currently analyzing using a DAILY model. I also track other markets using a WEEKLY model. The choice of timeframe isn’t random — it’s driven by options expiry cycles. Since these models are designed to work hand-in-hand with options trading, I align the model’s frequency with the available expiries. For example, SPX has daily expirations, so it gets a DAILY model. Stock ABC, on the other hand, might only have weekly expiries — so it gets a WEEKLY model. Simple logic.
(more…)