Slope of Hope Blog Posts

Slope initially began as a blog, so this is where most of the website’s content resides. Here we have tens of thousands of posts dating back over a decade. These are listed in reverse chronological order. Click on any category icon below to see posts tagged with that particular subject, or click on a word in the category cloud on the right side of the screen for more specific choices.

Price Is King

By -

Since I started posting on YouTube a few weeks ago we have doubled subscribers on our channel there to slightly under 500. I have calculated that if we can continue doubling subscribers every two months for the next three years then we can overtake the current biggest YouTube star, currently at about 80 million subscribers I think. I’m certain PewDiePie is watching our relentless march towards YouTube greatness with great concern. 🙂

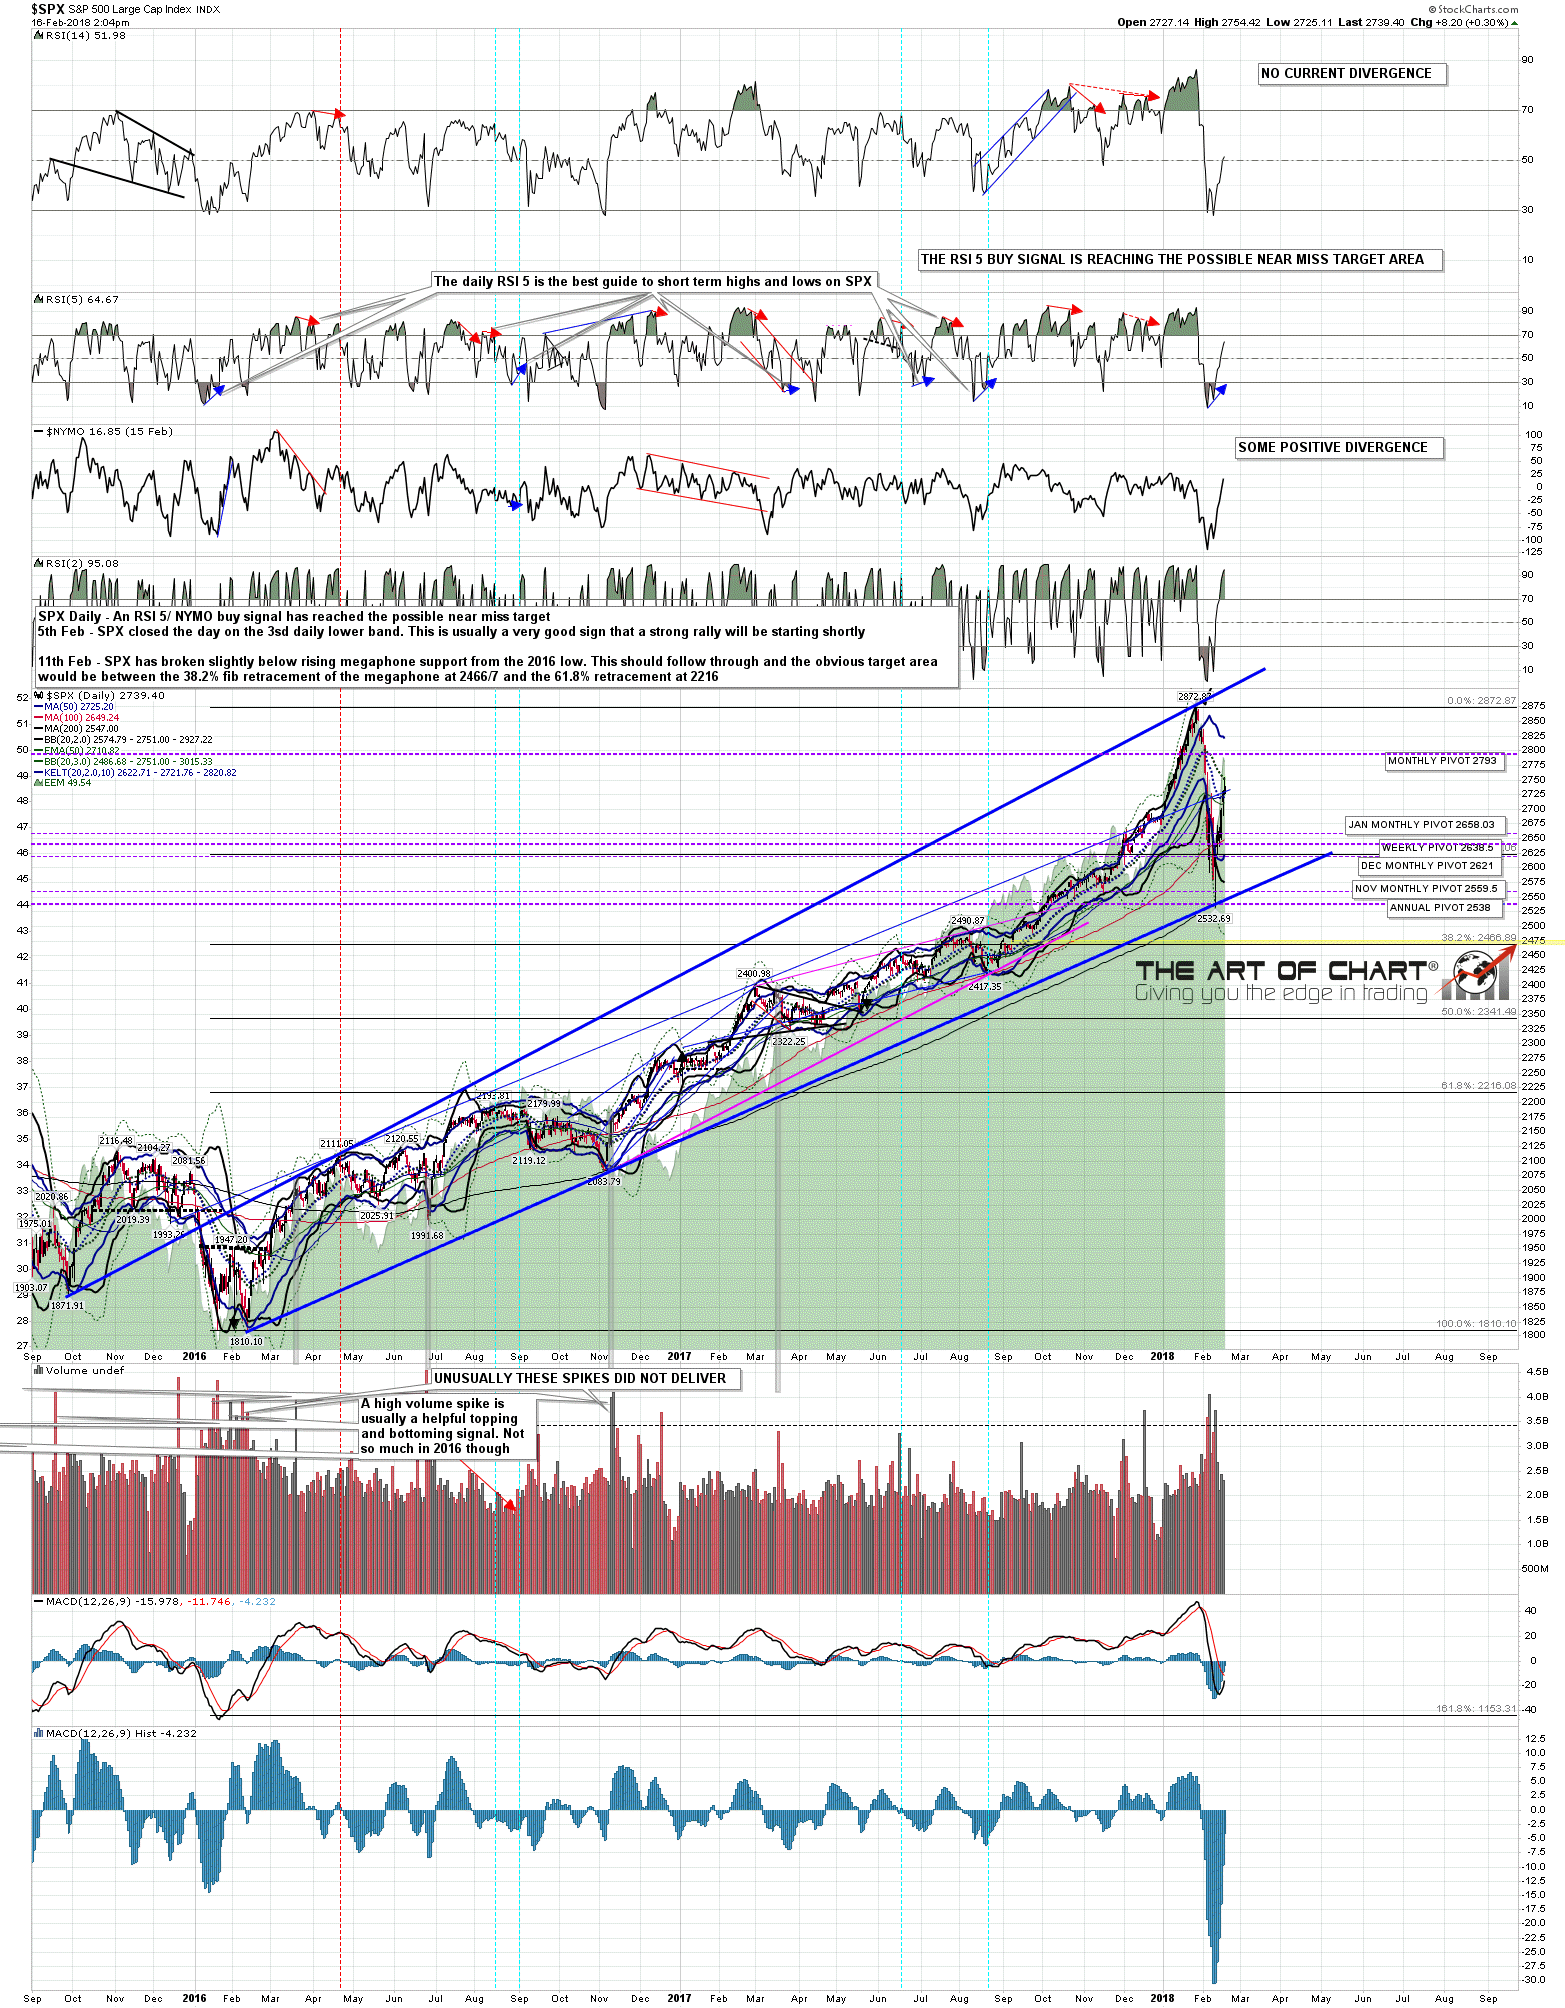
On the video below I’m looking at the option that SPX breaks over daily middle band at the close today, something that is now looking likely. That would make a retest of the recent high at 2754.42 likely in my view, and unless we were to then see a rejection candle below the daily middle band on Monday, then we might well see continuation higher. That would suck but price makes these decisions, not analysts. Intraday Video from theartofchart.net – Update on ES, NQ and TF: (more…)

Still Testing SPX Middle Band Resistance

By -

I try to post a full video once a week so I’m posting one today. If you’re just interested in the equity indices I cover those at the start of the video. Stan and I are doing two free webinars tonight, the first is on trade execution 30 minutes after the RTH close, and the second is on the big five stocks and sector ETFs an hour after the close. If you’d like to see either or both you can register for those on our February Free Webinars Page. Full Intraday Video from theartofchart.net – Update on ES, NQ and TF ….. and CL, NG, HG, GC, ZB, KC, SB, CC, ZW, DX, EURUSD, GBPUSD, USDJPY, USDCAD, AUDUSD and NZDUSD:

(more…)

We Will All Go Together When We Go

By -

I remember seeing the very talented satirist Tom Lehrer on his last world tour in the 1980s, ‘The Poisoning Pigeons In The Park’ tour. Today’s title is a small homage to one of my favorites in his repertoire, as well as a note that as and when equities are ready for the next leg down, all the main equity indices, and very possibly oil, are likely to participate. If you’d like to see the title song for this post you can see that here.

When that be? As soon as we see a break and conversion of the ES weekly pivot at 2703/4. I’m leaning towards to seeing a retest of Friday’s high before we see that happen. Intraday Video from theartofchart.net – Update on ES, NQ and TF: (more…)

Testing SPX Middle Band Resistance

By -

I have a question for my beloved readers today and I’m hoping one of you has a good answer. I’ve teamed up with an options expert friend to run a directional options portfolio based main on futures options for the last three months, and we’ve been recording the (very impressive so far) trades and results on a spreadsheet. We’d like to move this onto a professional web based alternative that we can publish from. The setup needs to work with futures options, auto-update the options prices, and not be restricted to basic options strategies etc. Do any of you know a good way to do this? The winning reply gets three months free membership if we later launch this as a paid service, which is where this is probably heading.

Onto the equity indices. I was mentioning yesterday that the daily middle band on SPX would be an ideal target for this rally and that has been tested on both SPX and ES this morning. Some rejection there so far and it’s possible that the rally high is in, though I’m sceptical about seeing a lot of downside in what remains of today, on an opex Friday, going into a three day weekend, so we’ll see. Intraday Video from theartofchart.net – Update on ES, NQ and TF:

Here’s the daily middle band test on SPX. Possible hourly RSI 5 sell signals are brewing on both SPX and RUT and one has fixed on NDX. Everyone have a great holiday weekend. 🙂 SPX daily chart:

180216 SPX Daily

Into The Likely Rally High Zone

By -

A couple of announcements today. Firstly tonight’s webinar at theartofchart.net has been delayed a week due to an unavoidable conflict, and will now be held on the same night as our Big Five & Sectors webinar on Thursday next week. You can register for either or both on our February Free Webinars page.

The second announcement is that Stan and I are finally starting serious work on writing a book on TA and trading futures. We have an outline and a publisher and will be trying to finish that this year, so watch this space 🙂

The hourly RSI 14 buy signals on NDX and RUT have reached target, and the SPX signal has reached the possible near miss target. There is hourly negative divergence here, and all three indices are in the ideal rally high zone, we are expecting a rally high high soon and tomorrow is a possible cycle trend day on which we could see a significant decline. Discussed in detail on my intraday video below.

This is the whole intraday video covering nineteen futures and forex charts, as I haven’t posted one of these in a couple of weeks, and if you are just interested in the equity indices they are at the start and there is also a possible very speculative equities decline scenario that I look at in the bonds/ZB section starting in the ninth minute. Intraday Video from theartofchart.net – Update on ES, NQ and TF: (more…)