Slope initially began as a blog, so this is where most of the website’s content resides. Here we have tens of thousands of posts dating back over a decade. These are listed in reverse chronological order. Click on any category icon below to see posts tagged with that particular subject, or click on a word in the category cloud on the right side of the screen for more specific choices.
This is my last post for 2024, and this is a good opportunity to have a bigger picture look at where we are in the current bull market run on Crypto, before I get on to the shorter term setup for the next few weeks. My crystal ball has been mislaid for the moment in an unfortunate dry cleaning snafu, but I will do what I can in the meantime using historical price action and math.
I wanted to show you all my much bigger picture Bitcoin (BTCUSD) weekly log scale chart vs NDX, which is really a very interesting chart. I will quickly go through some of the highlights from this chart.
‘How long might this rally last? Well given that today is 20th December I’m thinking this rally may well take us into Xmas and fairly shortly thereafter into lower lows. We shall see. ‘
Obviously today is now 30th December, tomorrow is the last trading day of the year, and as I was saying on Friday 20th December, I was expecting the rally to fail into lower lows shortly after Xmas. That may well be in progress now.
In my post yesterday I was looking at the possible bull flag setups on SPX, DIA and IWM, and today of course we have FOMC.
Those flags all ended yesterday on an encouraging note but overall this very much looks like an inflection point as we are coming into FOMC and it may well be that FOMC today determines the direction of the break from this.
In my last post on Friday I was looking at the support breaks on Dow & Russell and considering the wider implications of those. I was also leaning strongly towards the setup on SPX being a bull flag forming.
Since then a very nice bullish triangle has formed on SPX and, 70% of the time, these will break up towards the target, in this case a retest of the all time high at 6099.97. I wrote the comments on the chart when I posted it on my twitter last night and since then SPX has broken slightly below triangle support, which is a concern, but is rallying well from there so far. Assuming this morning’s low holds, the bullish scenario still looks nice.
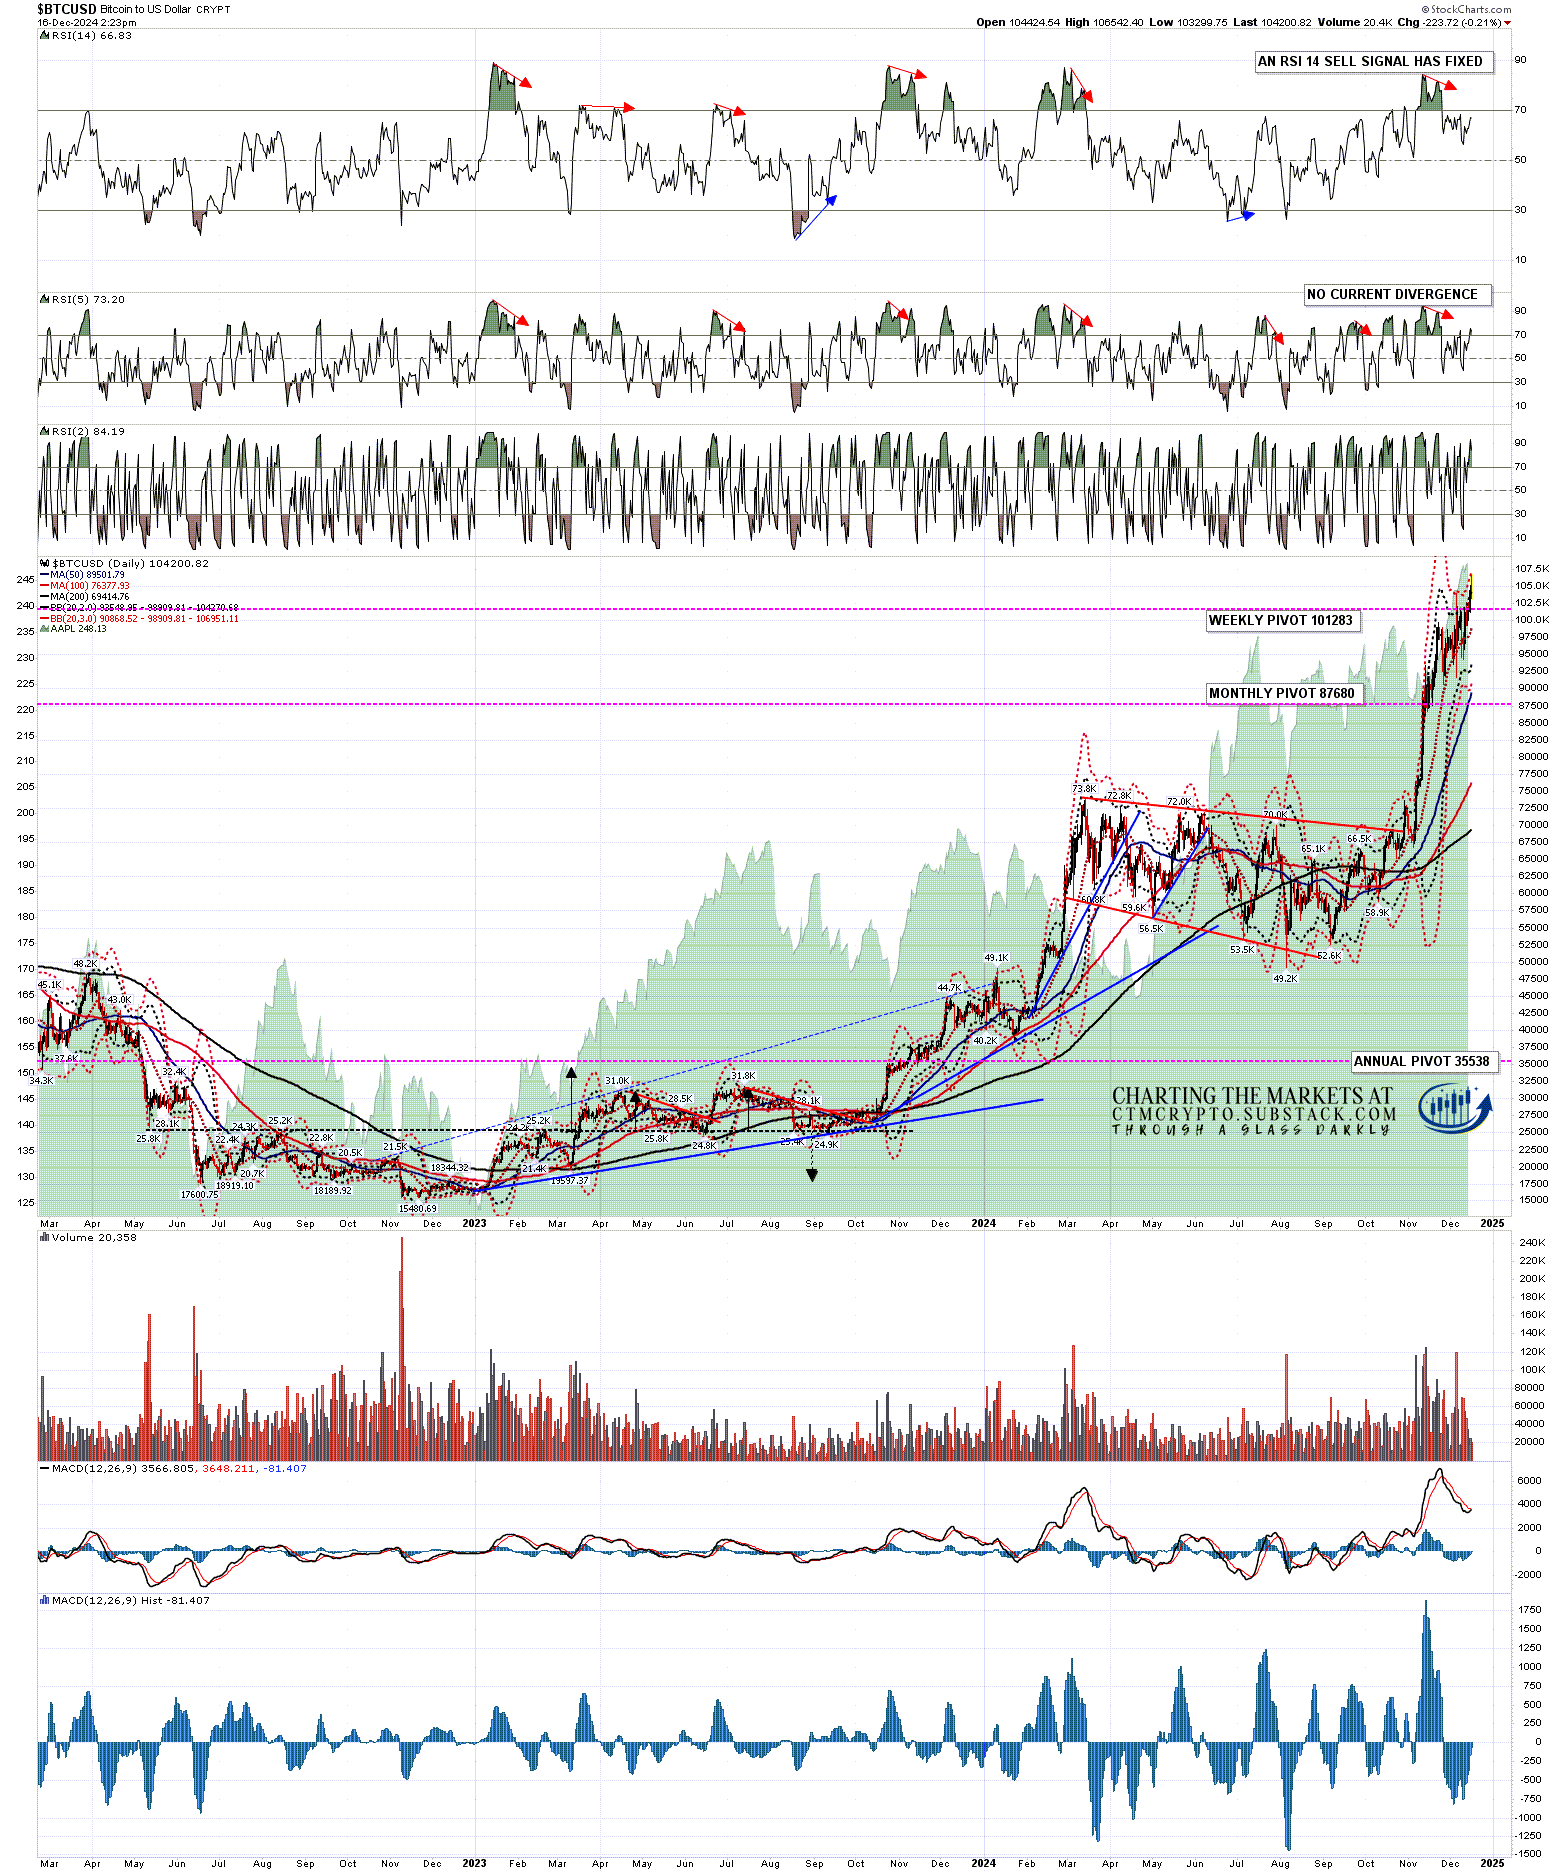
In my last post on Wednesday I was looking at the bullish leaning setups on Bitcoin (BTCUSD), Ethereum (ETHUSD) and Solana (SOLUSD) Both Bitcoin and Solana had daily RSI 14 sell signals two weeks ago of course, and Ethereum (ETHUSD) also had one fix last week, so now all three have fixed daily RSI 14 sell signals. These are likely signalling a larger retracement coming in the first months of next year, but I’m not expecting to see that in December …. most likely.
On the daily chart Bitcoin had backtested and held the daily middle band last week and I was looking for a new all time high. We saw that over the weekend and Bitcoin is getting close to the 3sd upper band, currently at 108315. That hasn’t been hit yet but, if hit, that may signal the start of another modest consolidation before going higher.
BTCUSD daily chart:
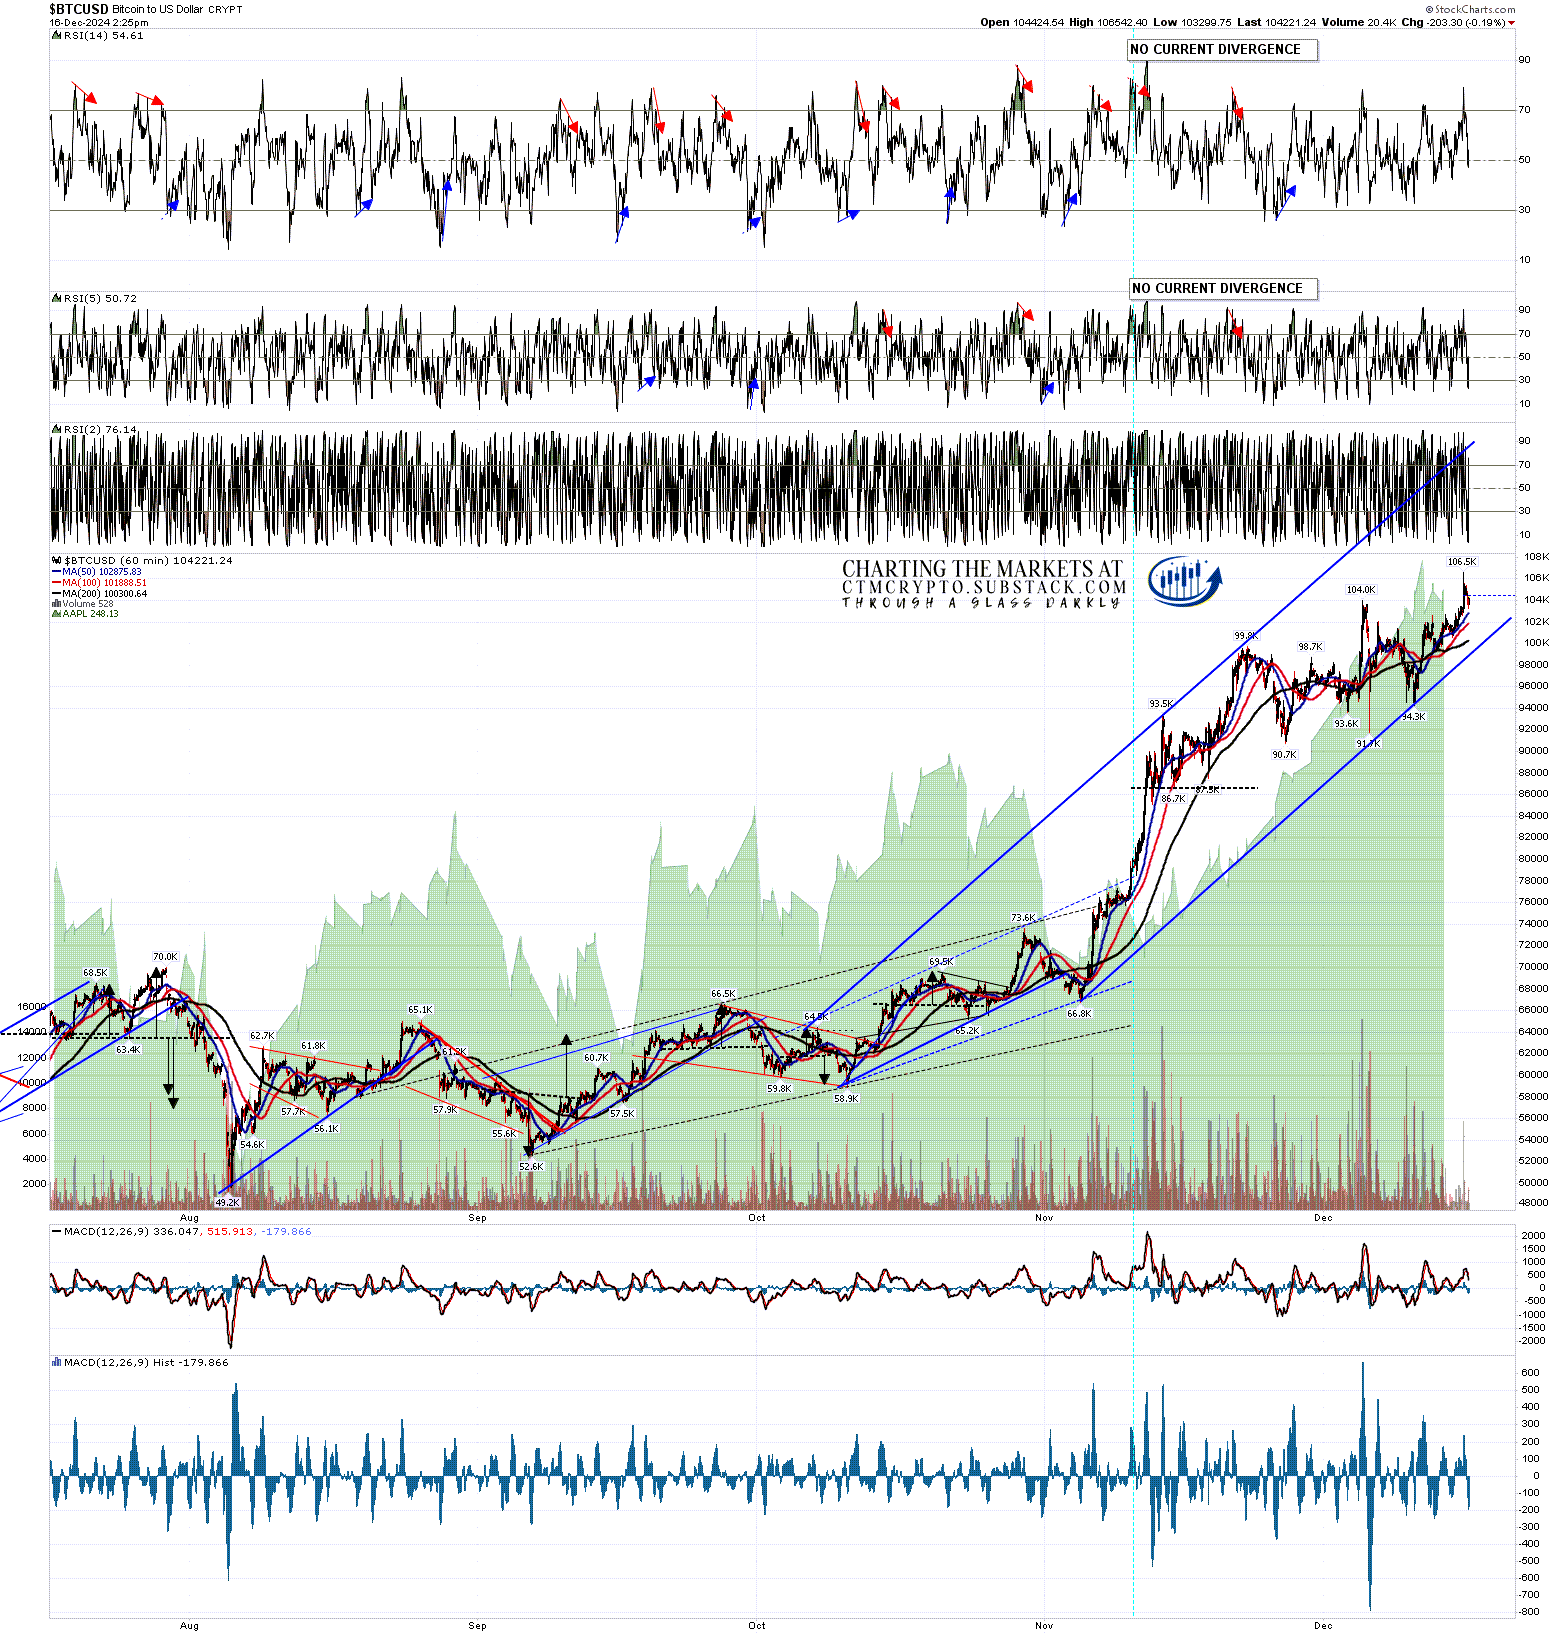
On the hourly chart I have rising support from the November low at 66.8k currently in the 99k area and am wondering whether the next big target might be the channel resistance parallel to that rising support, currently in the 118k area.
BTCUSD 60min chart:
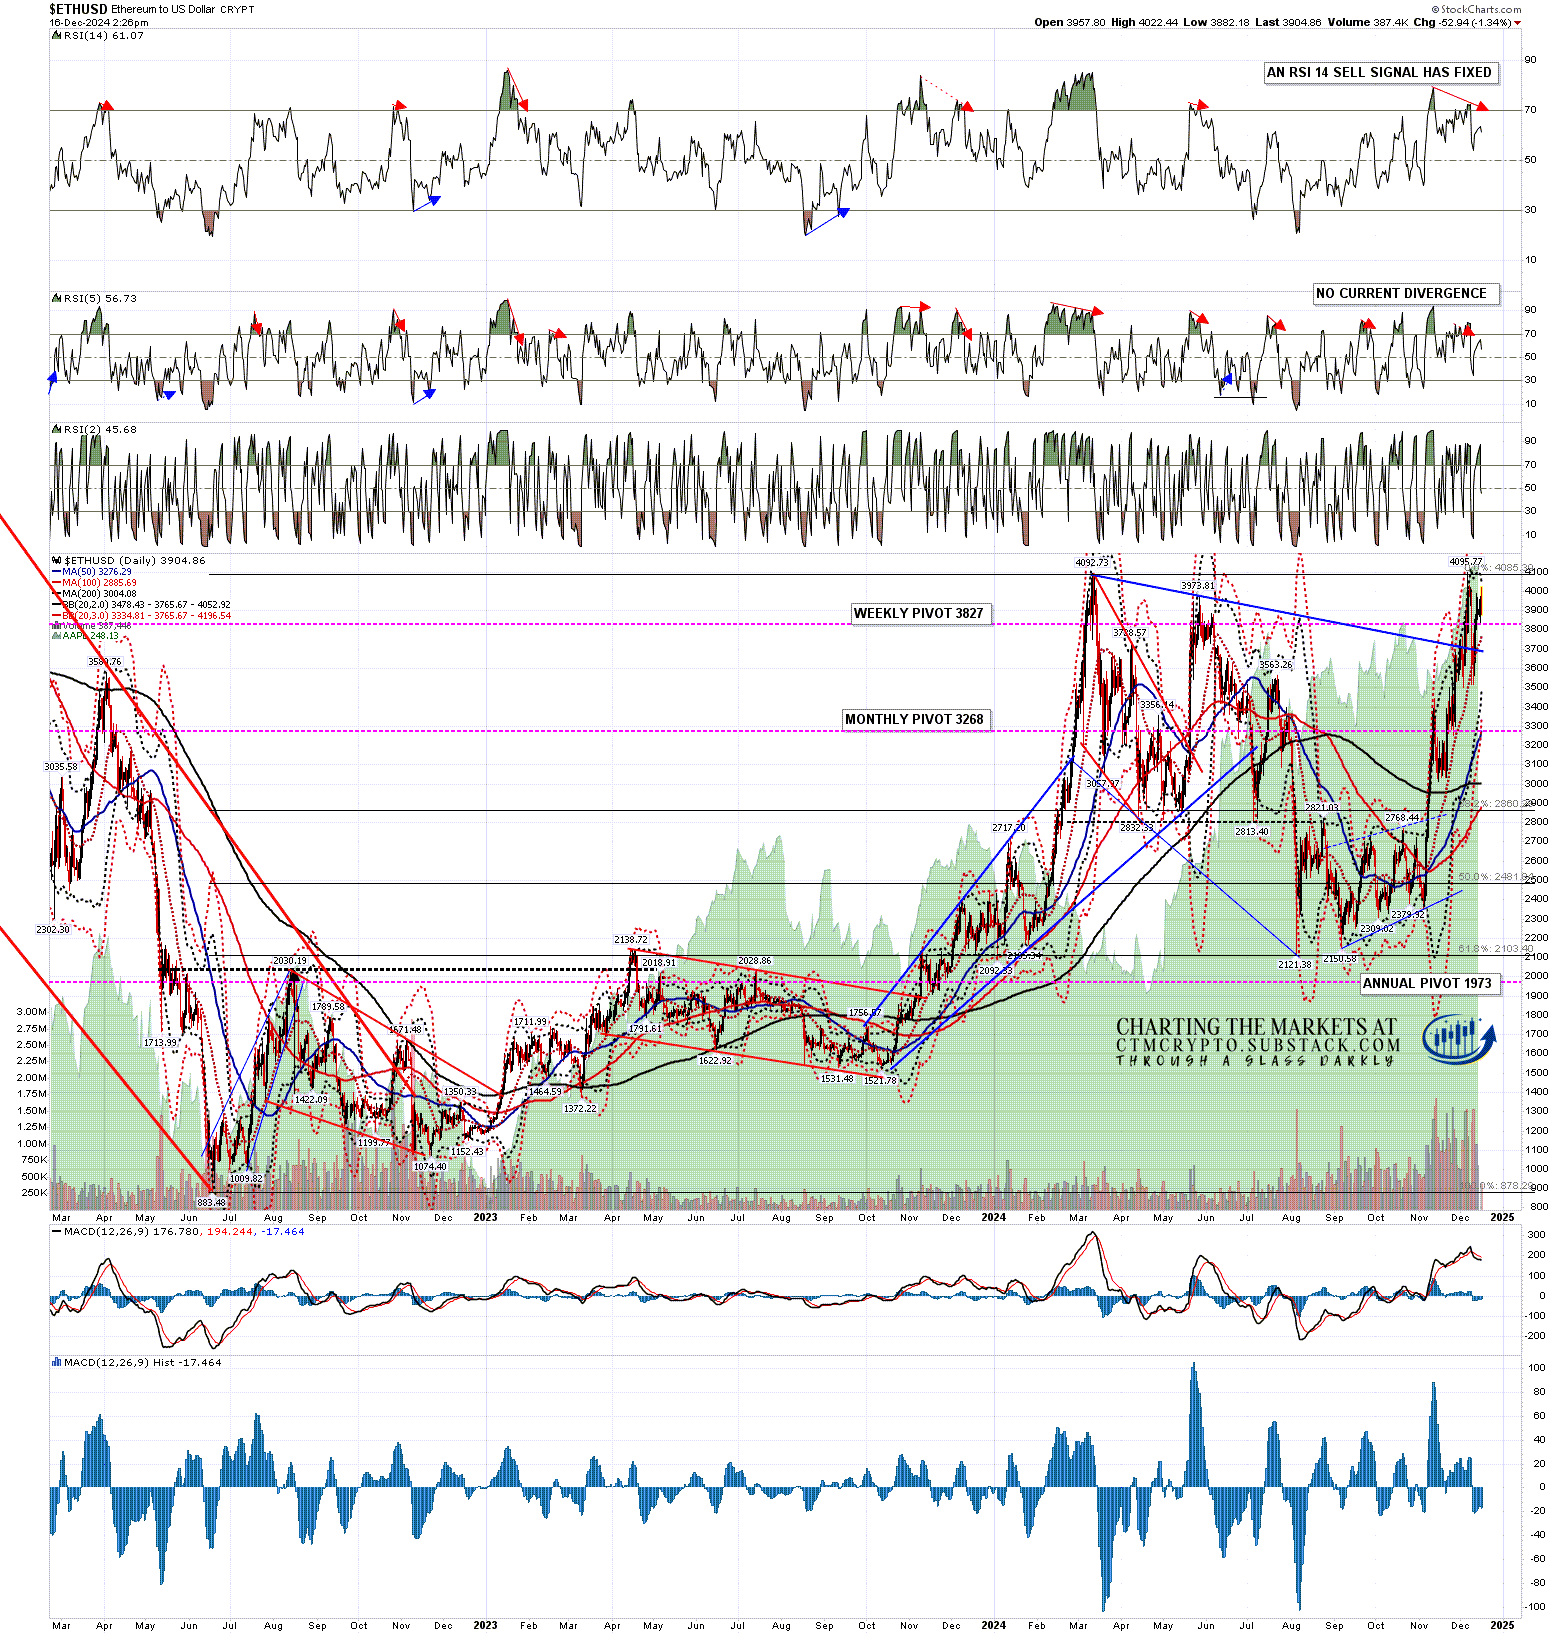
Ethereum backtested the daily middle band on the last retracement and held it. I was saying last Wednesday that the next obvious target was a retest of the 2024 high at 4095.77, reached today, and I have an eye on now the next big target, which is a retest of the 2021 all time high at 4865.94.
ETHUSD daily chart:
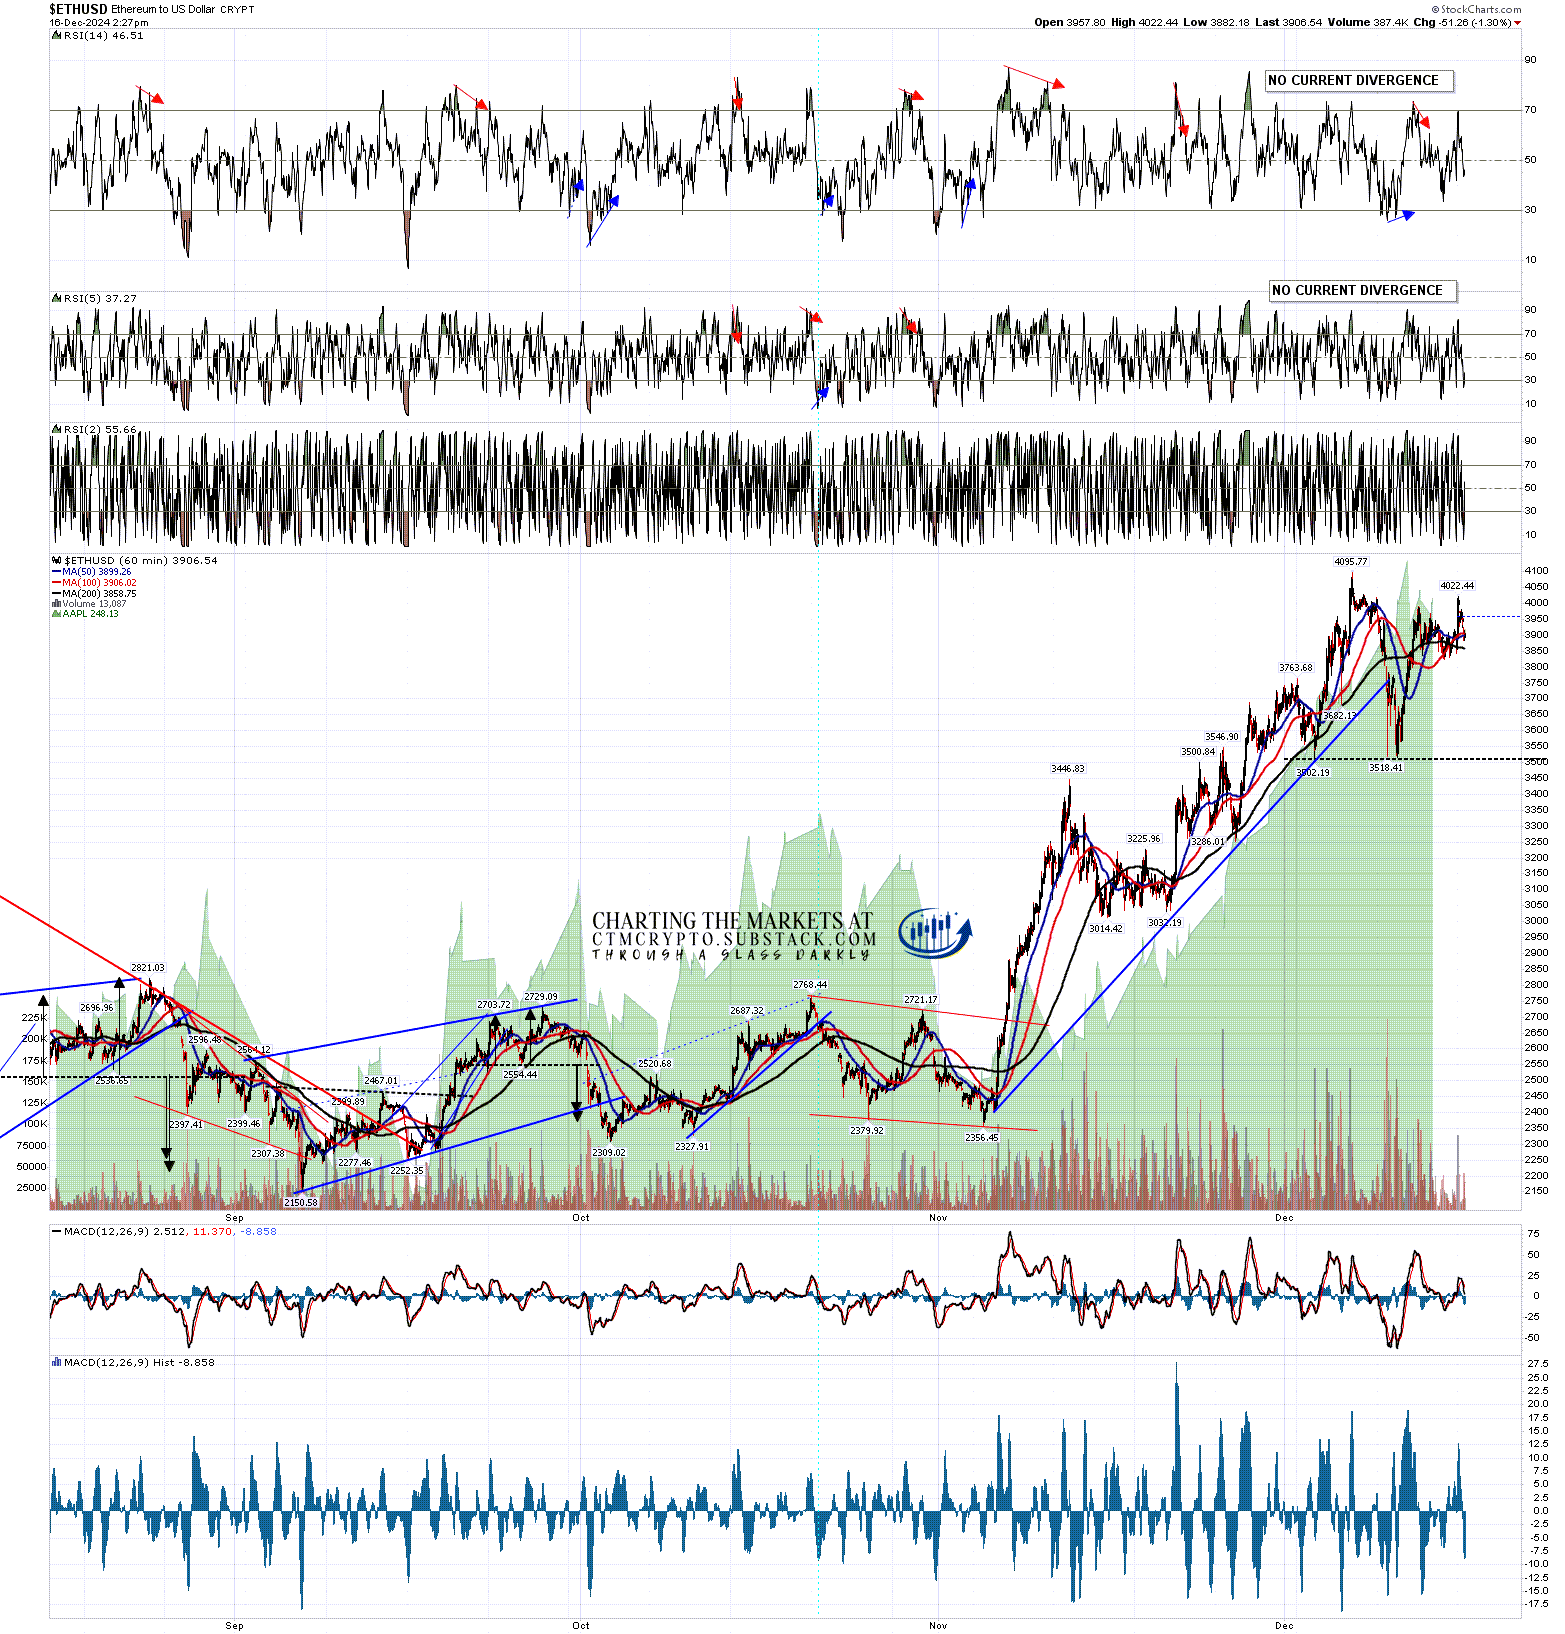
On the Ethereum 15min chart last week (not shown) there was a double bottom that had broken up with a target in the 4050 area, which was reached of course, and now that the 4095.77 high has been retested I would note that there is a now possible double top setup here on Ethereum, though I’m not seeing any obvious reason to expect that to play out at the moment.
ETHUSD 60min chart:
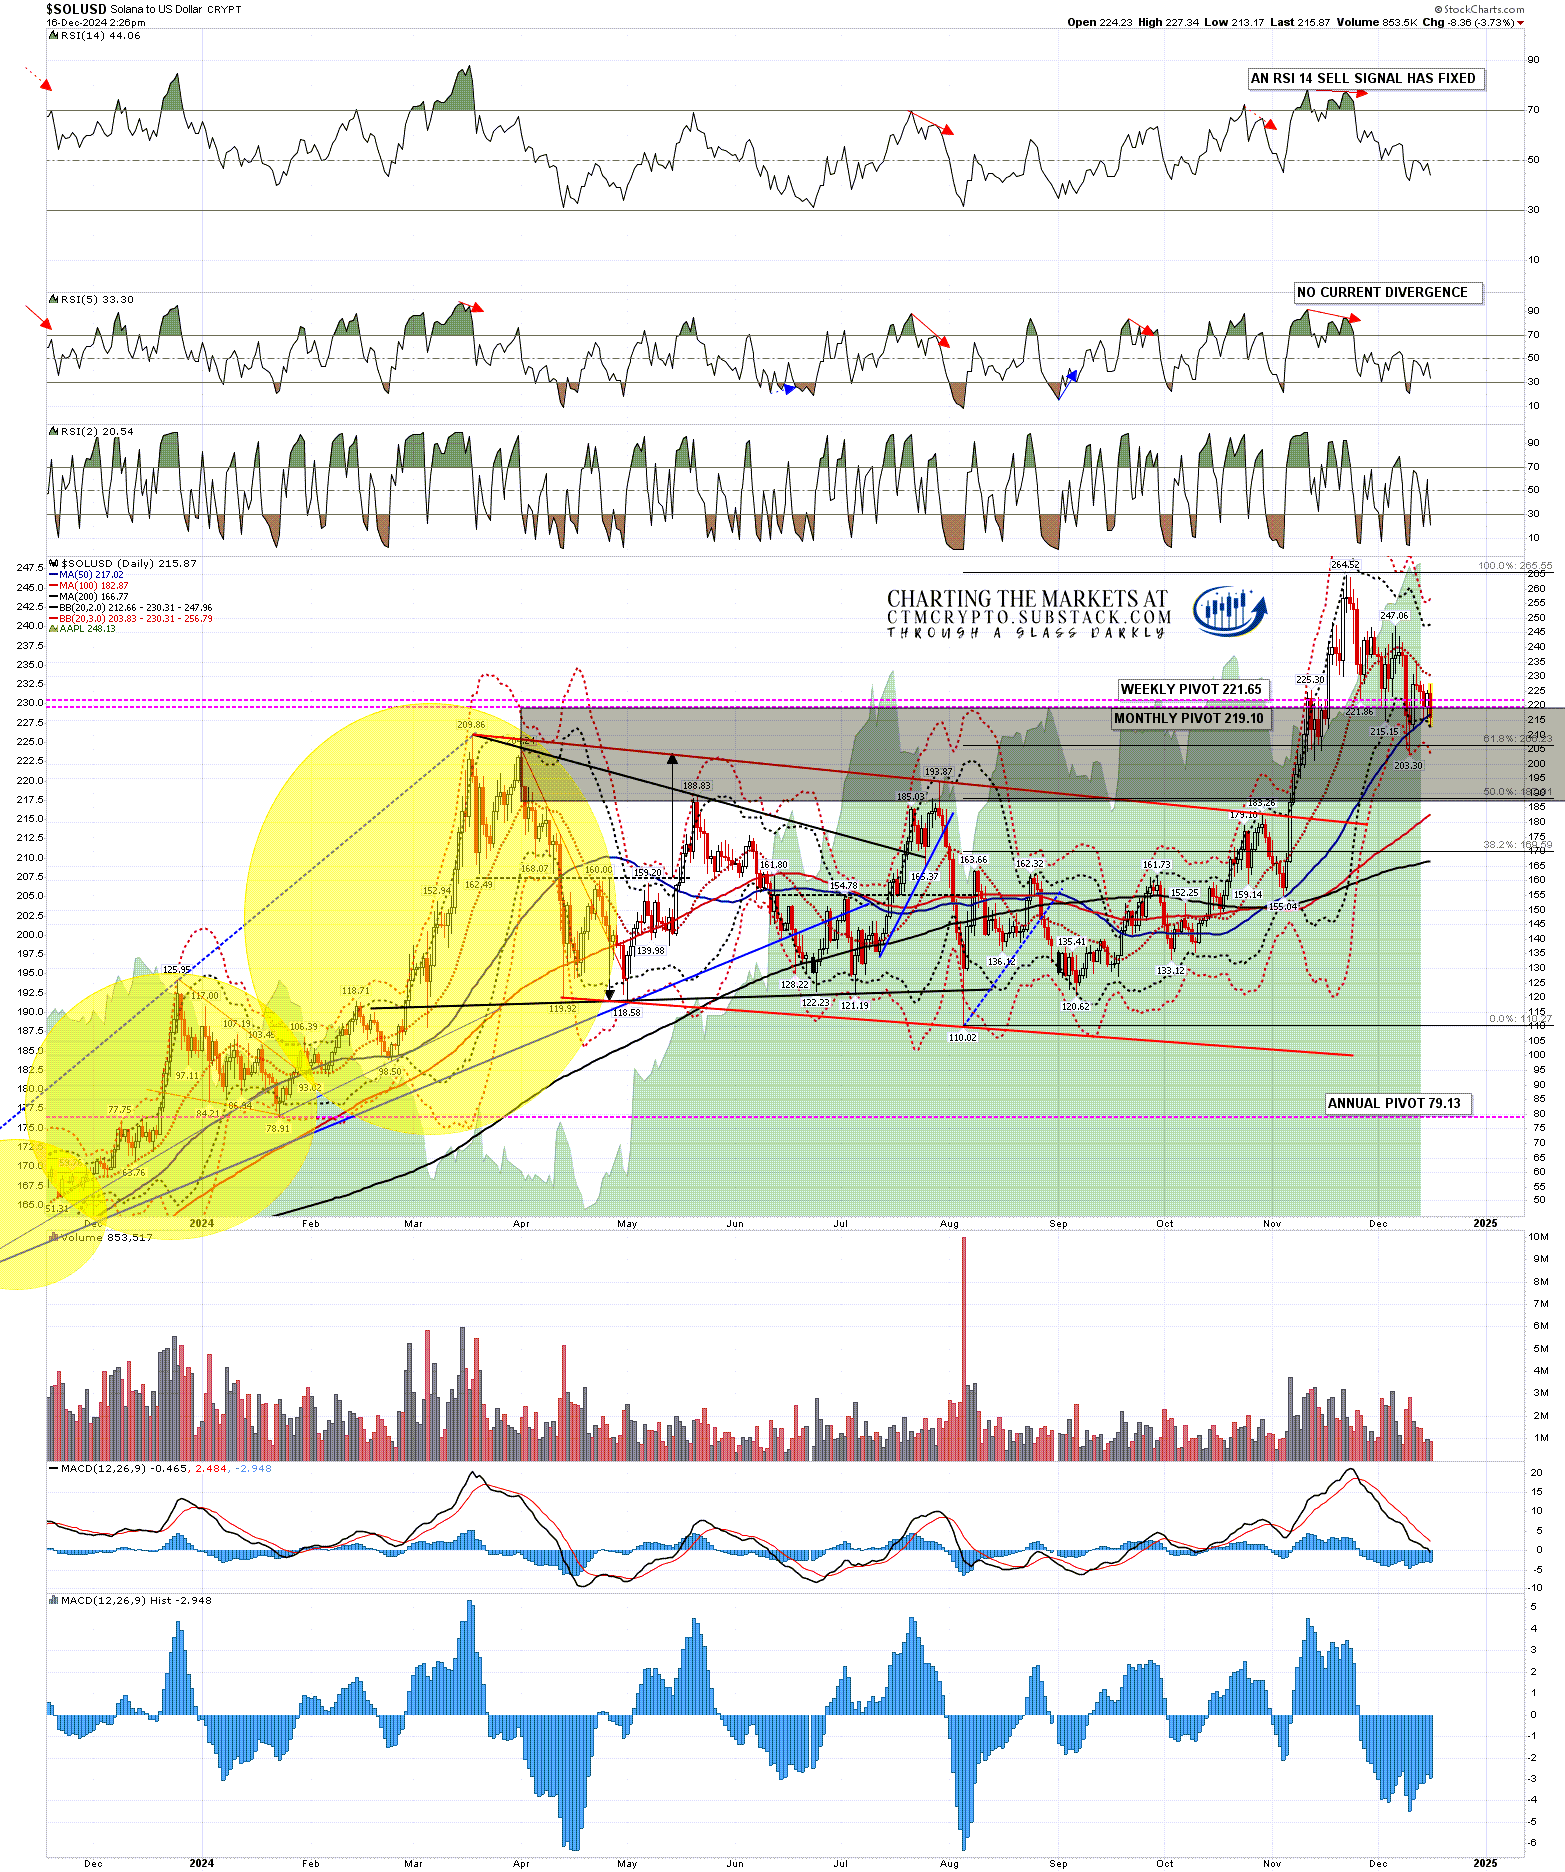
Solana has been the problem child over the last few days. I was saying on Wednesday that the daily middle band, which had been holding repeatedly as resistance over the previous ten days, needed to be broken and converted to support to open a retest of the all time high at 264.52, and we haven’t seen that yet, with the rally last week failing at the daily middle band again.
SOLUSD daily chart:
There is still a fixed double bottom target at 237.5 to 240 (shown on the 15min chart in my last post), and either Solana makes that target or it then likely retests the last low at 203.30. If seen that may well be the second low of a larger double bottom with a target on a sustained break over 234.75 at a retest of the all time high.
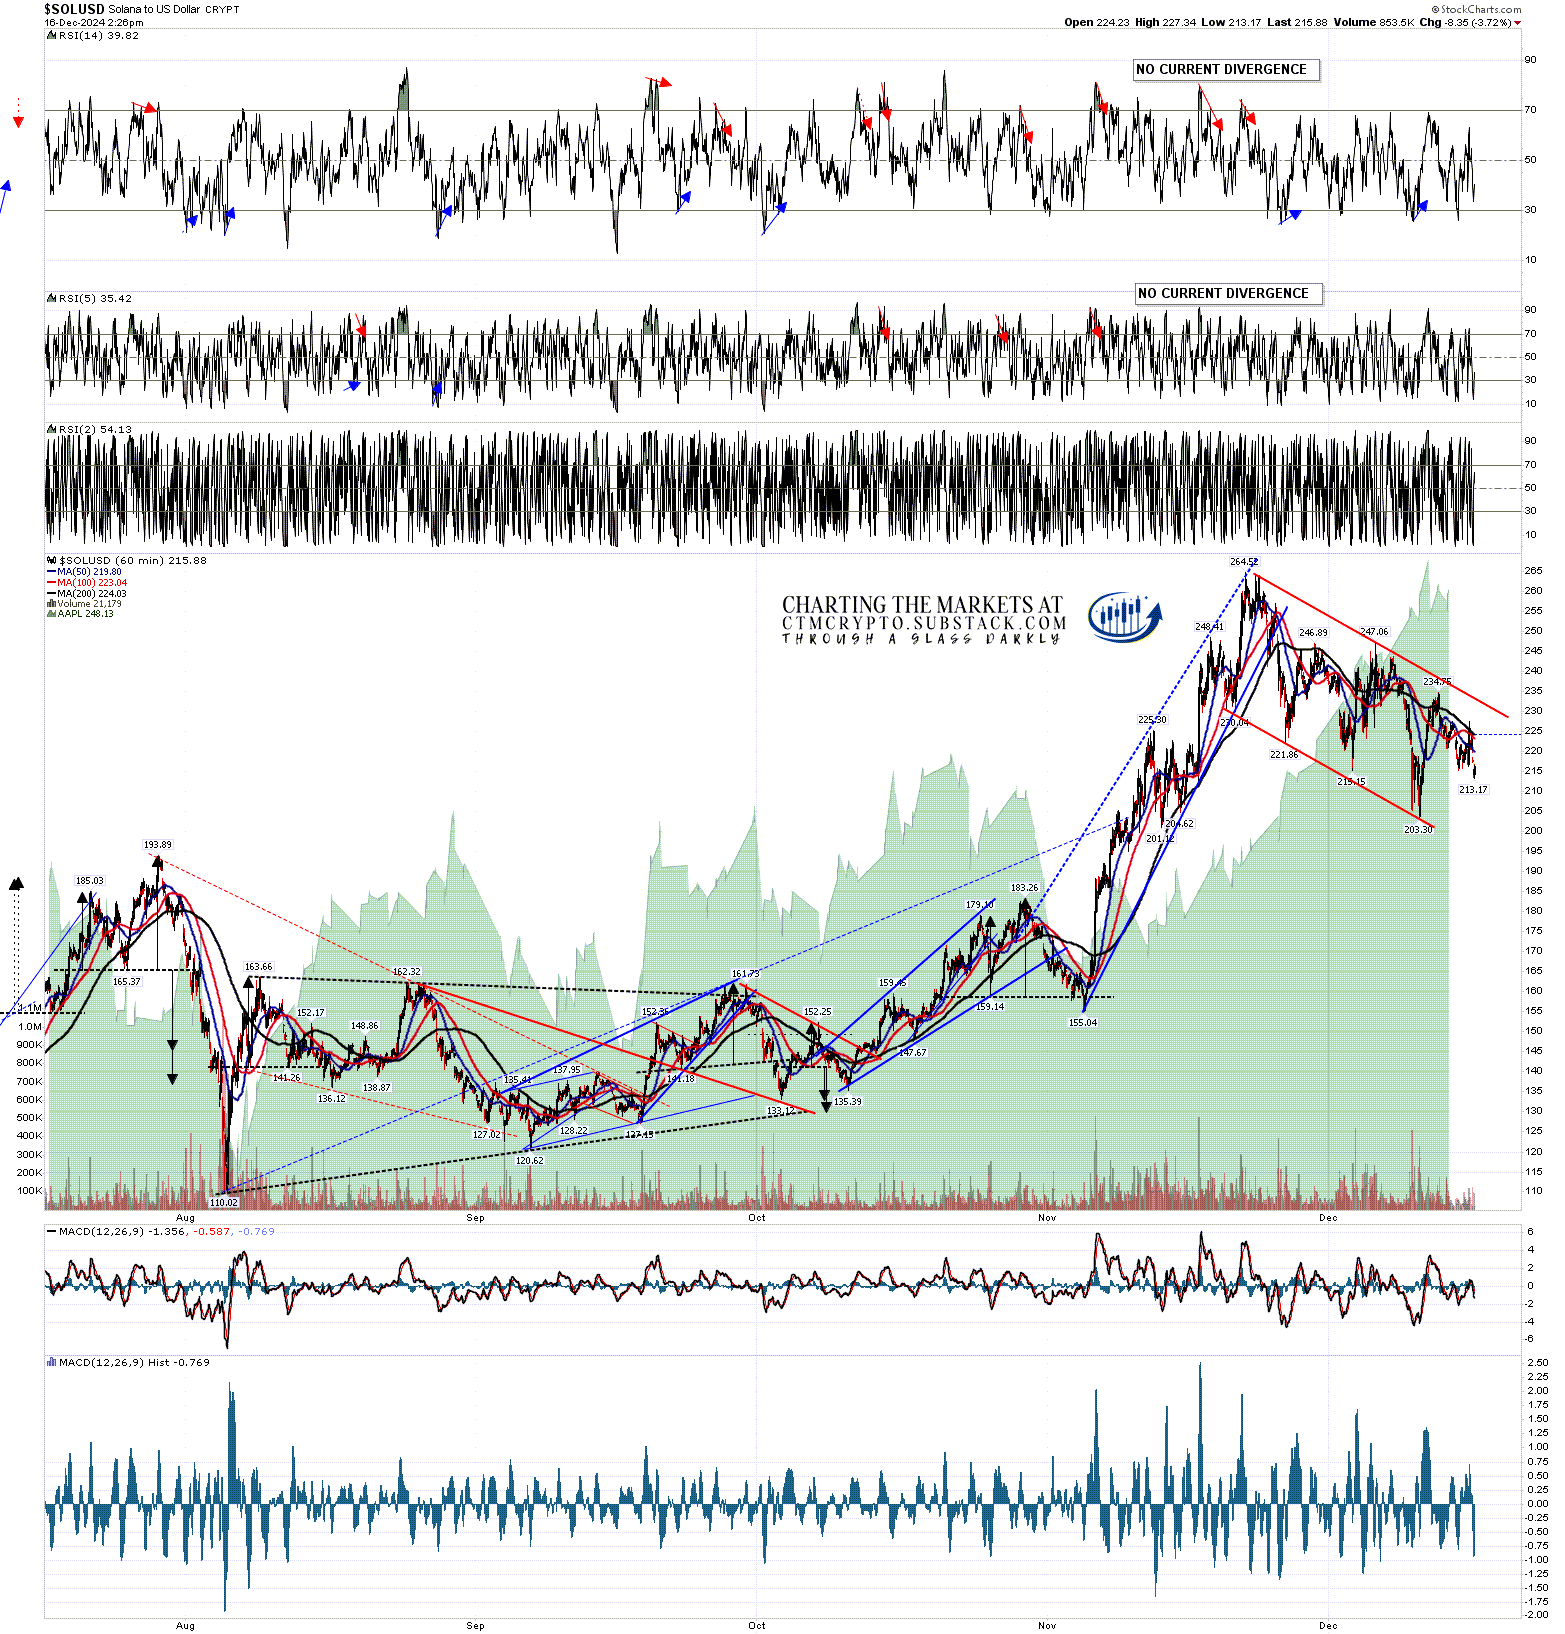
The current setup on Solana is a high quality bull flag channel and 70% this breaks up now or after a low retest. The 30% break down option is worth a look here though as there is a possible large H&S here (not shown on the chart below) that on a sustained break below 200 would have a target in the 138 area. This isn’t something I’m thinking is likely to play out, but in the event that we were to see a hard break down on equities over the next few days, which I’m really not expecting, that could deliver.
Bull flag channel resistance is now in the 233 area, and a sustained break above looks for a retest of the all time high at 264.52.
SOLUSD 60min chart:
On the bigger picture I’m leaning bullish across the board with the caveat that the fixed daily RSI 14 sell signals on Bitcoin, Solana and Ethereum are warning that a longer and deeper consolidation may be coming within a few weeks. There is always a chance that retracement might arrive earlier, though December would not be an obvious time to see that.
If you’d like to see more of these posts and the other Crypto videos and information I post, please subscribe for free to my Crypto substack.
I do a premarket video every day on Crypto at 9.15am EST. If you’d like to see those I post the links every morning on my twitter, and the videos are posted shortly afterwards on my Youtube channel.
I’m also to be found at Arion Partners, though as a student rather than as a teacher. I’ve been charting Crypto for some years now, but am learning to trade and invest in them directly, and Arion Partners are my guide around a space that might reasonably be compared to the Wild West in one of their rougher years.