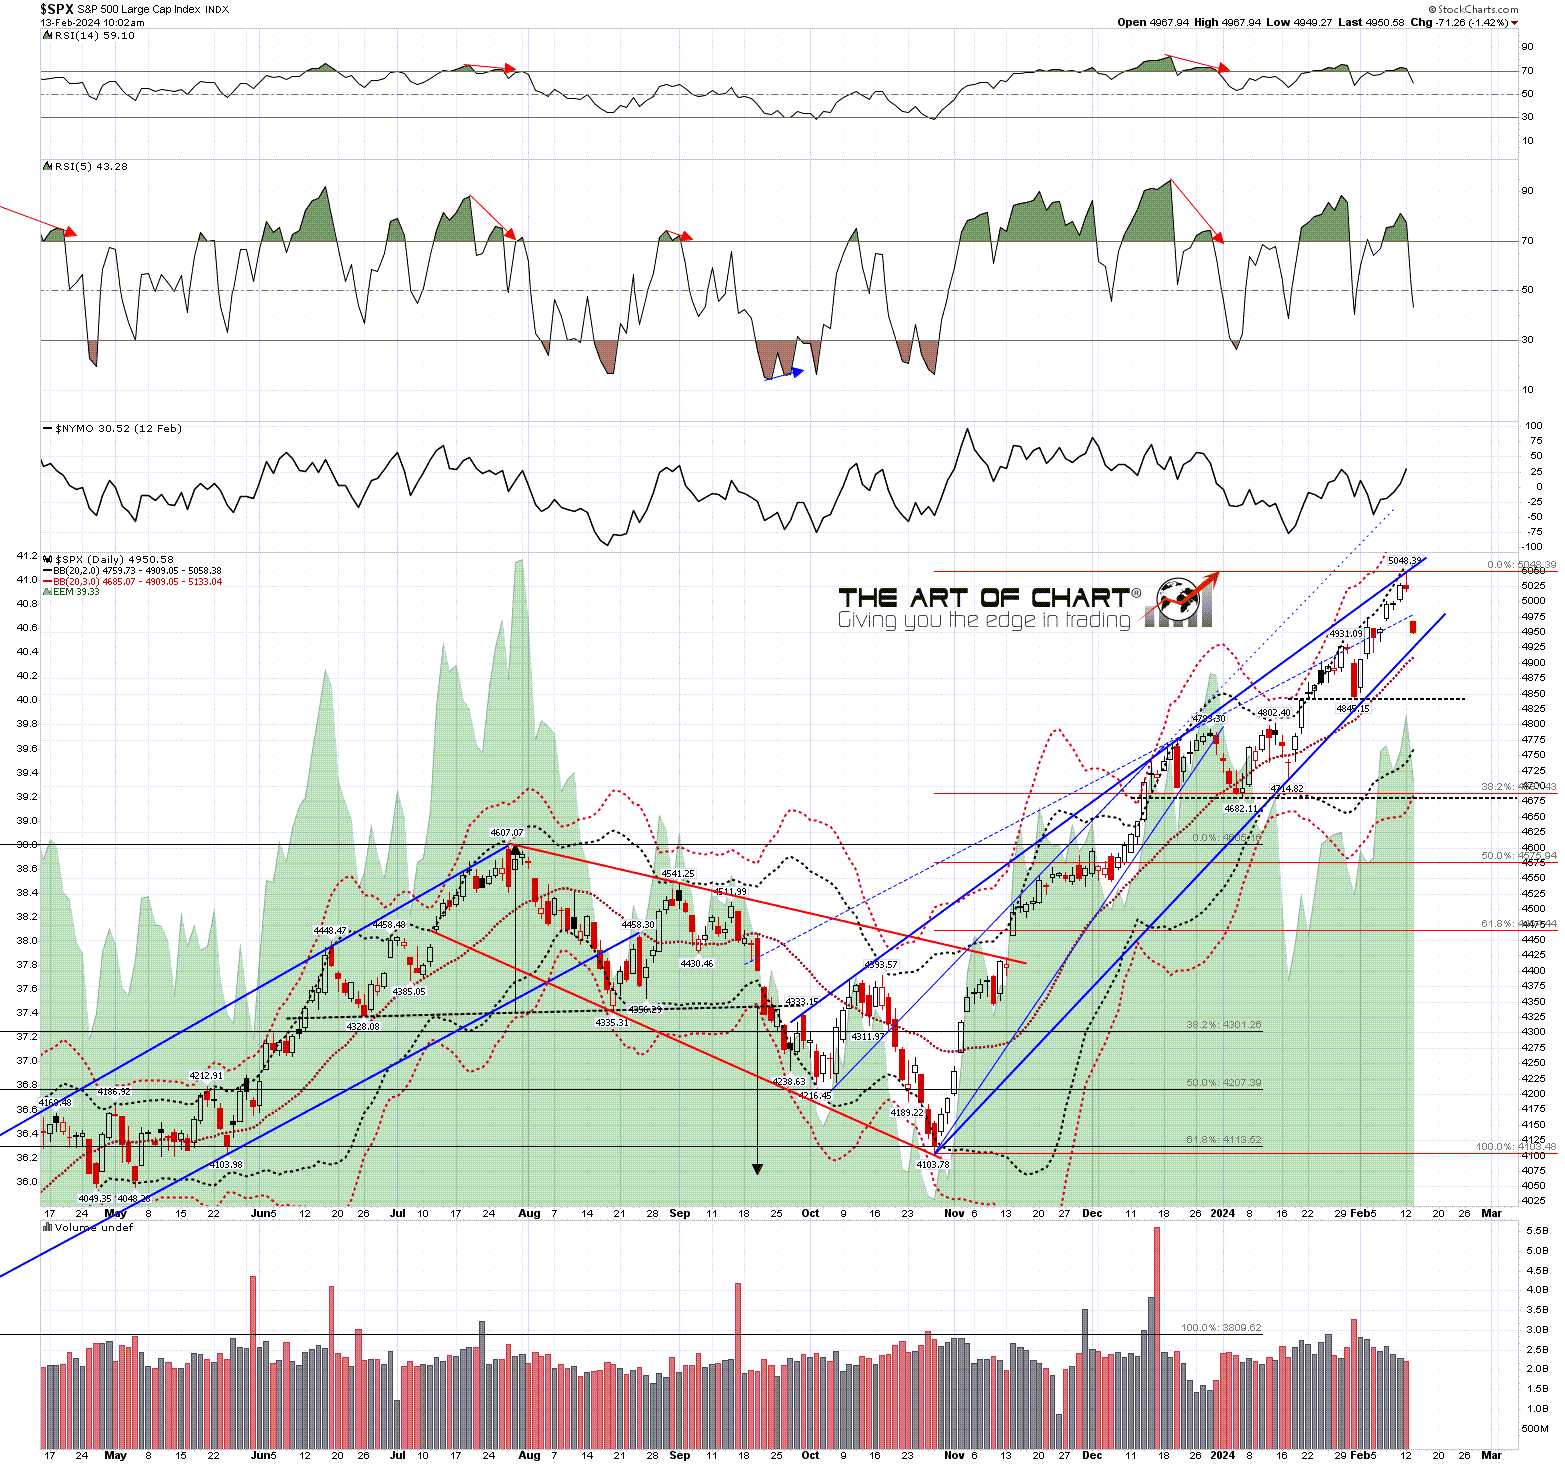
Slope of Hope Blog Posts

Slope initially began as a blog, so this is where most of the website’s content resides. Here we have tens of thousands of posts dating back over a decade. These are listed in reverse chronological order. Click on any category icon below to see posts tagged with that particular subject, or click on a word in the category cloud on the right side of the screen for more specific choices.

A Modest Proposal

By -

On Thursday night last week I posted a public model trade on my twitter taking a short on ES at 4561.75 looking for the 4350 area. That trade was in thirds, I posted all entries and exits in real time on twitter, and I took the last two thirds at 4399 yesterday for an average gain of 142.5 handles per third. It was a nice trade, and I picked the high area using the SPX 5min chart below on an impressively sweet setup shown below. This move was only a part of the overall scenario here however.

SPX 5min chart (from 14th Sept):

(more…)

A Festival of Flags

By -

SPX has seen a decent retracement from the highs, the reversion to the mean target at the 45dma has been hit, and a lot of decent looking bull flags have been forming on US indices. SPX may now be close to a retracement low, and a daily RSI 5 buy signal fixed a couple of days ago. The overall setup here is strongly suggesting that the next move on SPX may be a retest of the 2023 high at 4607.07.

SPX daily chart:

(more…)

So What Next?

By -

Pretty much everything I have written about in my last few posts on SPX delivered. The bull flag wedge from the high broke up. The IHS that then formed broke up and made target, and the bull flag made the target with a retest of the June high.

So what now? Well I was saying that I was expecting a retest of the high to form a topping pattern setting up a larger move down in a reversion to the mean move. The level I use as the mean is the 45dma and that is now at 4287. The last two such moves broke down through it and, if so, I would be wondering about a possible target at the main rising support trendline from last year’s low, currently in the 4090 area.

(more…)

Binary Decision Point

By -

I was looking earlier this week on the very high quality falling wedge that had formed on SPX from the last high and considering the odds that it was a bull flag setting up a retest of the high.

Since then the wedge has broken up, retraced about 50% of the decline, and an IHS has formed with a target back at a retest of the last high.

At this stage there are only two main options. Firstly that the IHS breaks up, converts the neckline to support, and goes on to retest the last high, and secondly that SPX drops back through 4360, and likely then retests the last low at 4328.09, and then very possibly down further. It is very likely that we will see one of those two options happen next.

(more…)