Today is the last trading day of 2023, and is the only significantly bearish leaning day this week. Historically the stats today indicate 38.1% stats for SPX closing green, and only 28.6% green closes on NDX. That doesn’t of course mean that the day will be particularly interesting, but intraday at least the last couple of days have been more interesting than I was expecting.
On the bigger picture, I was looking for a retest of the 2023 high on SPX to set possible daily RSI 14 and RSI 5 sell signals brewing, and we saw that. The high this week so far is at 4793.30, just 25 handles below the all time high, and I’m still thinking that a decent retracement looks very close, and that SPX might make a marginal new all time high before we see that retracement.
Either way we appear to be setting up for an interesting January.
SPX daily chart:

On the bigger picture, I was looking for a retest of the 2023 high on NDX to set possible daily RSI 14 and RSI 5 sell signals brewing, and we saw that too.
NDX daily chart:

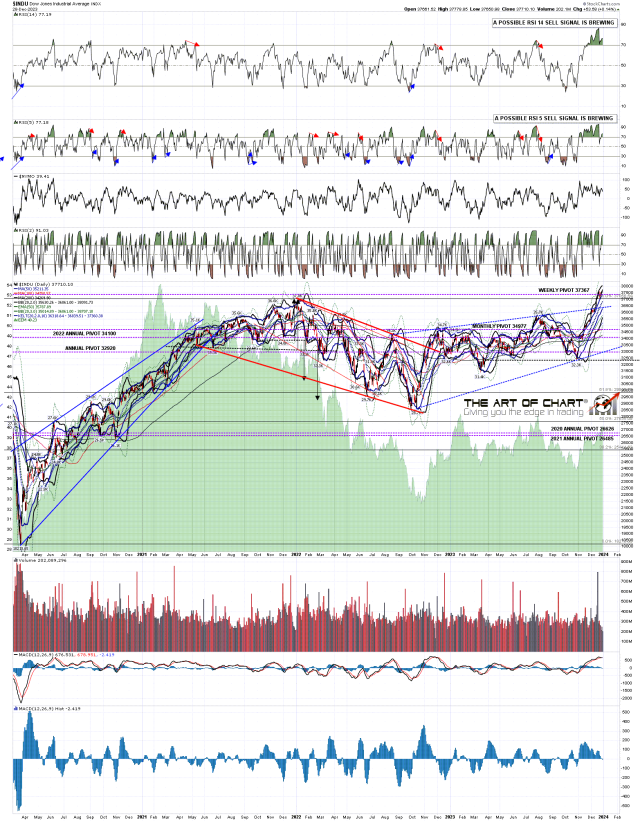
On the bigger picture, I was looking for a retest of the 2023 high on Dow to set possible daily RSI 14 and RSI 5 sell signals brewing, and we saw that too.
INDU daily chart:

IWM already had possible daily RSI 14 and RSI 5 sell signals brewing, so now we have these brewing on all four of the main US indices that I watch. I was trying to remember the last time I saw this and actually I can’t recall ever seeing this happen before. Regardless it is a strong indication that a sharp retracement at minimum is likely in the near future.
IWM daily chart:

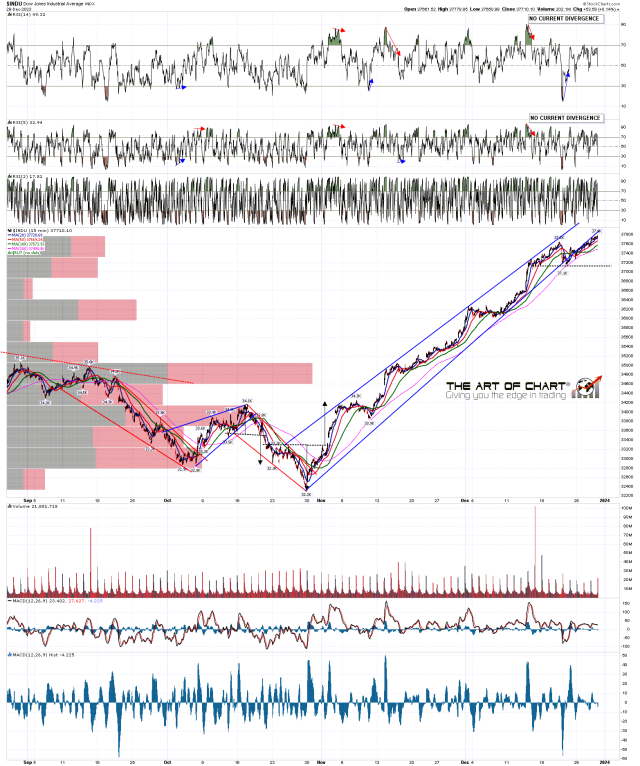
The main pattern from the October low that I’ve been watching is the rising wedge on Dow. That had just started breaking down when I posted that on Tuesday and looks like topping action since. We could see more short term highs but another test of the wedge resistance trendline is looking unlikely.
INDU 15min chart:

I still think that a new all time high is coming on SPX in coming weeks and months, though we may see a strong retracement first. If we are going to see that all time high retest soon then my lean would be that we would likely see that latest in the first week of January. It’s possible we might see that today, but with the historical stats leaning bearish at the last day of the quarter and year I’d be surprised to see that.
What are the news points that may influence the next year? Well it is a presidential election year, and it’s worth noting that of the 32 presidential election years since 1896, only six have delivered declines for the year of more than 5%. Secondly the inverted yield curve is telling us that a recession is likely on the way as and when that inversion ends, though that may arrive too late in the year to affect it much. Thirdly the inflation numbers have been flattered in recent months by falling energy prices, and there are decent odds that significant lows are forming on both oil and natural gas, so that may have the opposite effect on inflation numbers for much of 2024. That may well affect the number of interest rate reductions we see this year, though I think the odds look decent that the interest rate cycle has topped out for now.
Altogether I think the signs are good that 2024 may be an interesting year and a fun year to trade. We’ll see. Everyone have a great holiday weekend and be prepared for an interesting January on the markets, as I think that looks very likely. 🙂
A couple of announcements today. Stan and I did our 2024 forecasts Chart Chat at theartofchart.net on Sunday 17th December and if you would like to watch that you can see that embedded on our December Free Webinars page, or directly here. Forecasts as usual on equity indices, bonds, energies, precious metals and other commodities & one of our best I thought.
We are also running our annual end of year sale at theartofchart.net offering an additional 20% off annual memberships in addition to the 20% of we usually offer. If you are thinking of signing up for an annual subscription you can check that out here.
If you are enjoying my analysis and would like to see it every day (including a daily premarket video) at theartofchart.net, which I co-founded in 2015, you can register for a 30 day free trial here. It is included in the Daily Video Service, which in turn is included in the Triple Play Service.


