Slope of Hope Blog Posts

Slope initially began as a blog, so this is where most of the website’s content resides. Here we have tens of thousands of posts dating back over a decade. These are listed in reverse chronological order. Click on any category icon below to see posts tagged with that particular subject, or click on a word in the category cloud on the right side of the screen for more specific choices.

Mayday

By -

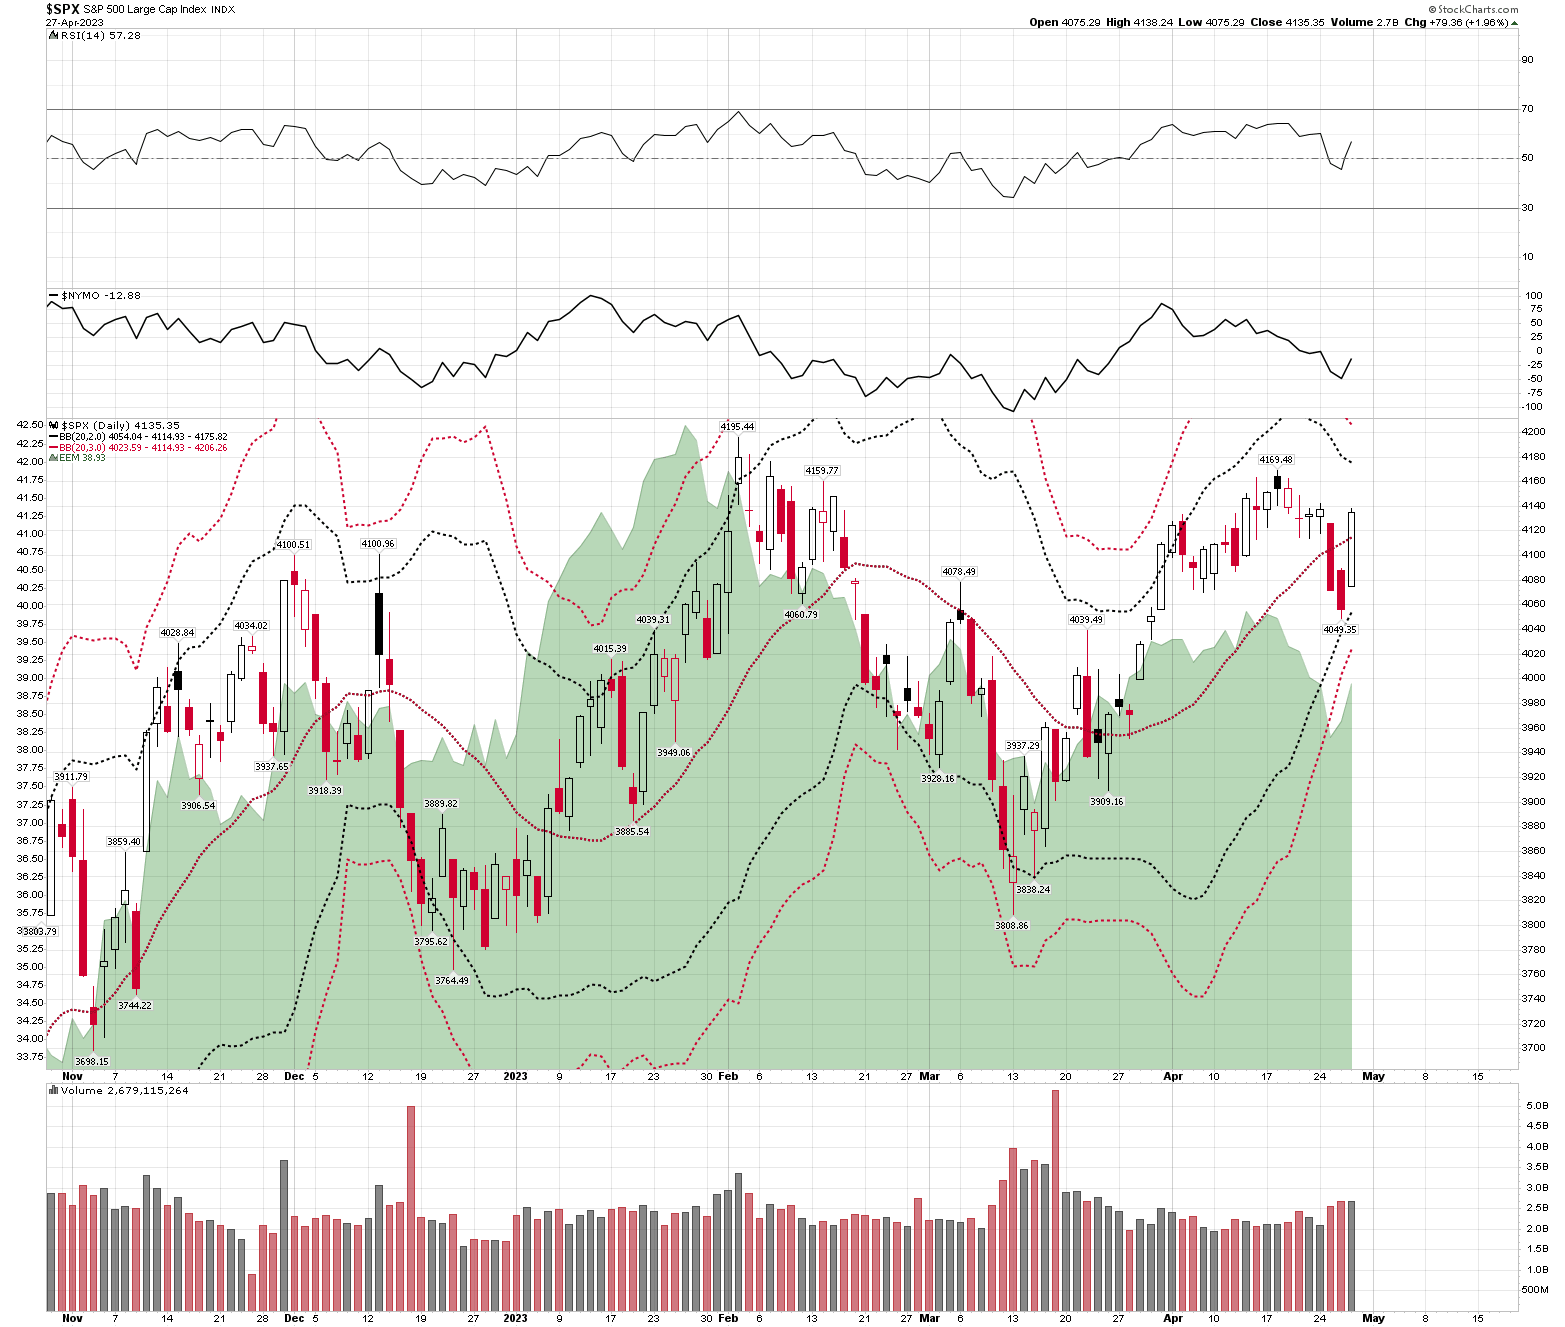
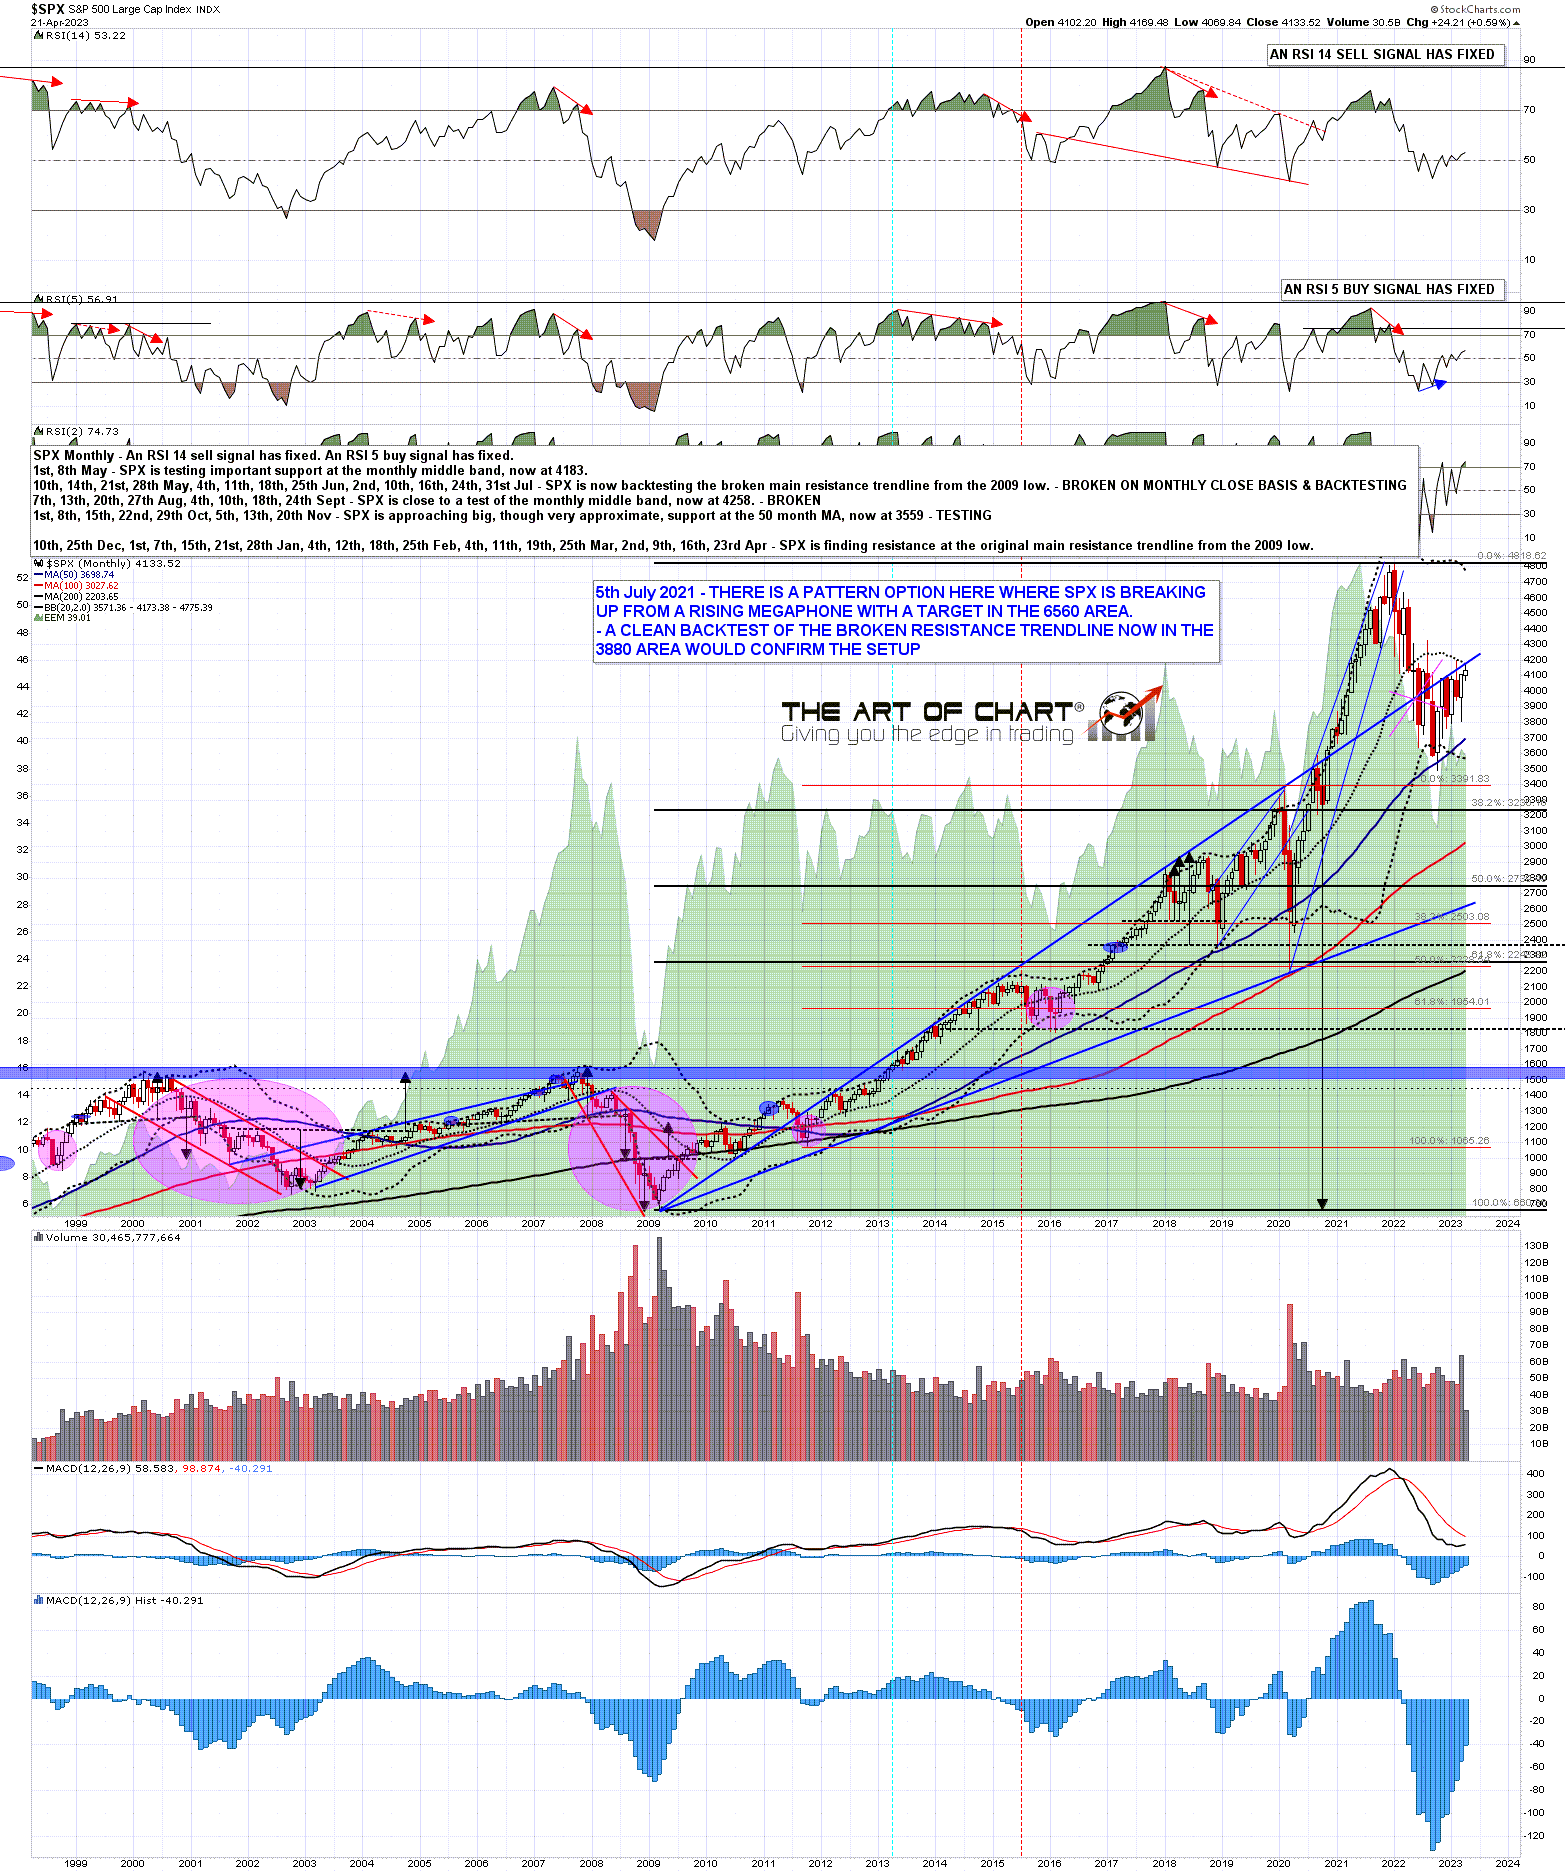
SPX broke up through the possible H&S setup on Friday and delivered a full retest of the April high, closing the month six handles under key resistance at the monthly middle band and testing the main support/resistance trendline from the 2009 low. So what now?

Well, this is the main resistance that SPX has been failing at, and we now have the high quality topping pattern that I’ve been looking for, on decent quality hourly negative divergence, with matching topping patterns and divergence on other indices. This is the inflection point, right here, and the odds strongly favor SPX failing here into at least a strong retracement, and very possibly a leg down into a new bear market low.

(more…)

Possible High Being Made

By -

SPX went down a little further than was ideal, and then rallied very hard yesterday, so the topping pattern scenario is still on track.

The break below the daily middle band confirmed on Wednesday and SPX broke back hard over the middle band again yesterday. A close over 4115 again today will confirm the break back above. There is the option of a hard rejection back below that today, which would be unusual on a Friday, but definitely possible as today is the last day of April, and the stats for that lean 67% bearish.

SPX daily BBs chart:

(more…)

Topping Step One Completed

By -

I was talking on Friday and Monday about the likely topping process now in progress on SPX here, and the possibility that SPX would head down into the possible H&S neckline in the 4070 area, supported by the daily RSI 5 sell signal that had fixed. That target was reached yesterday, and the daily RSI 5 sell signal made and exceeded the target at the 30 level on the daily RSI 5.

SPX daily chart:

(more…)

Failing At Strong Resistance

By -

The main resistance for the downtrend on SPX since the all time high is twofold, and those two resistance levels are currently crossing.

The first level is the monthly middle band, which has a long track record of acting as main support in an uptrend, and main resistance in a downtrend. That is currently at 4173 and the high this week was at 4169, so that was an almost perfect test.

The second level is the trendline from the 2009 low that was resistance in 2010, then resistance for multiple tests in 2012-14, 2018 & 2020 until it was broken hard in the collapse upwards after the 2020 low. After that was broken as support last year it has held as resistance twice, and has seen a third test this week that has held perfectly so far.

(more…)