
SPX broke up through the possible H&S setup on Friday and delivered a full retest of the April high, closing the month six handles under key resistance at the monthly middle band and testing the main support/resistance trendline from the 2009 low. So what now?
Well, this is the main resistance that SPX has been failing at, and we now have the high quality topping pattern that I’ve been looking for, on decent quality hourly negative divergence, with matching topping patterns and divergence on other indices. This is the inflection point, right here, and the odds strongly favor SPX failing here into at least a strong retracement, and very possibly a leg down into a new bear market low.
SPX monthly chart:

On the bigger picture there are two patterns here. The first is a decent quality double top that on a sustained break below 3808.86 would look for a retest of the 2023 low at 3491.58, and beyond that there is still an open H&S target in the 3400 area, at the retest of the 2020 high before the COVID crash. That is a very attractive target and a possible level to see a bear market low.
SPX daily chart:
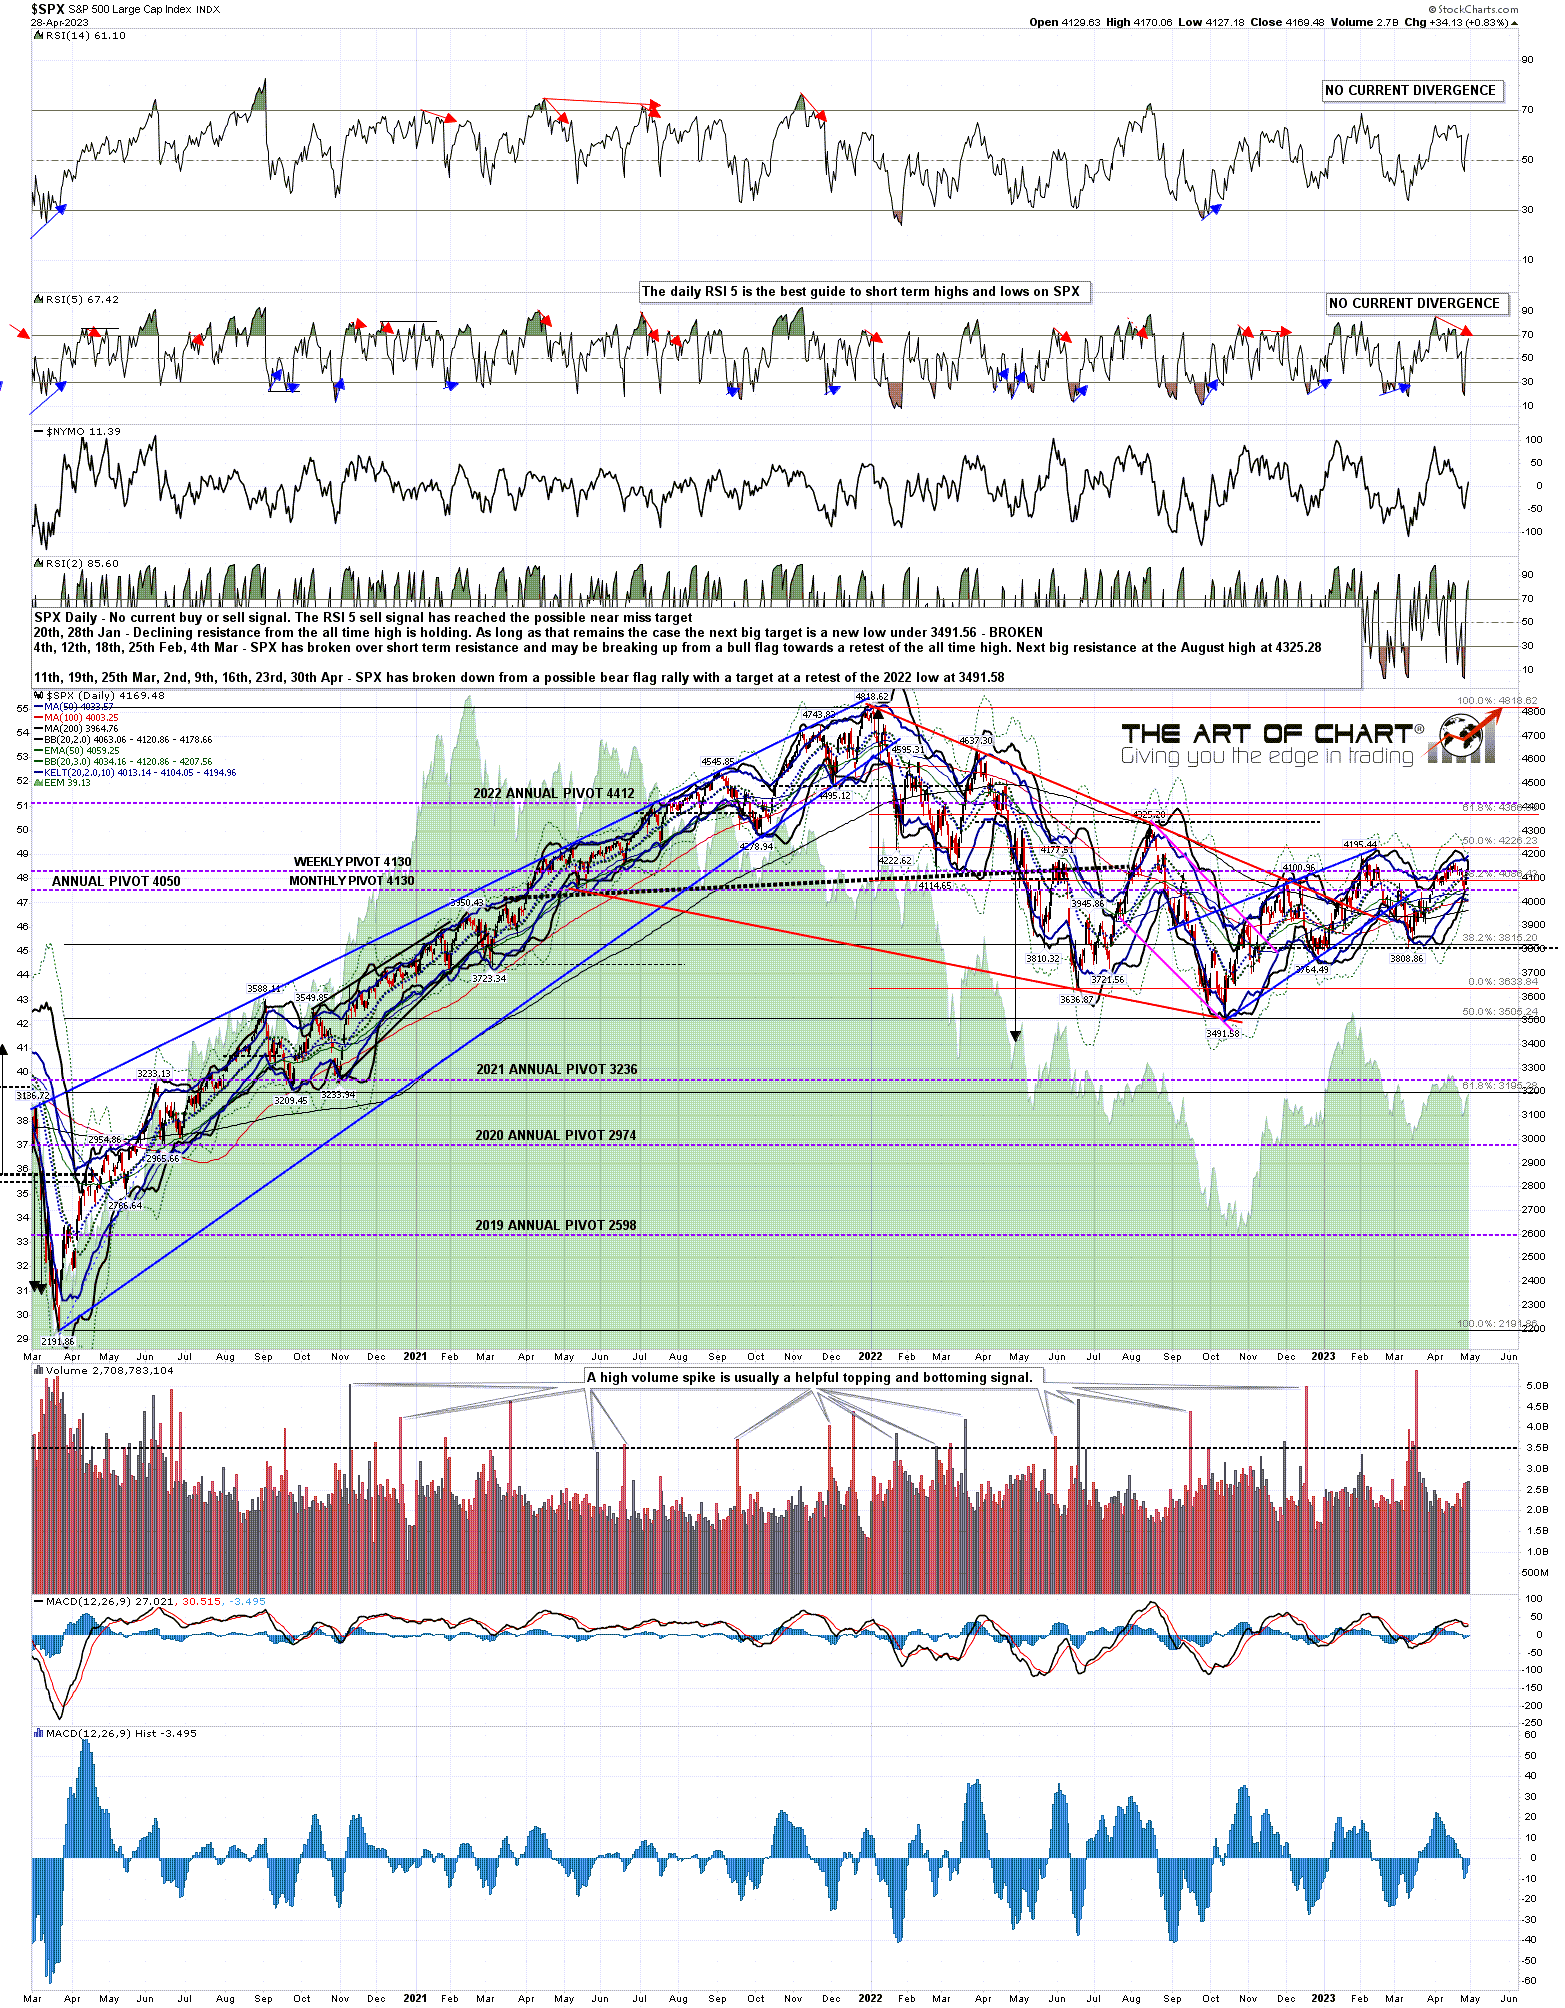
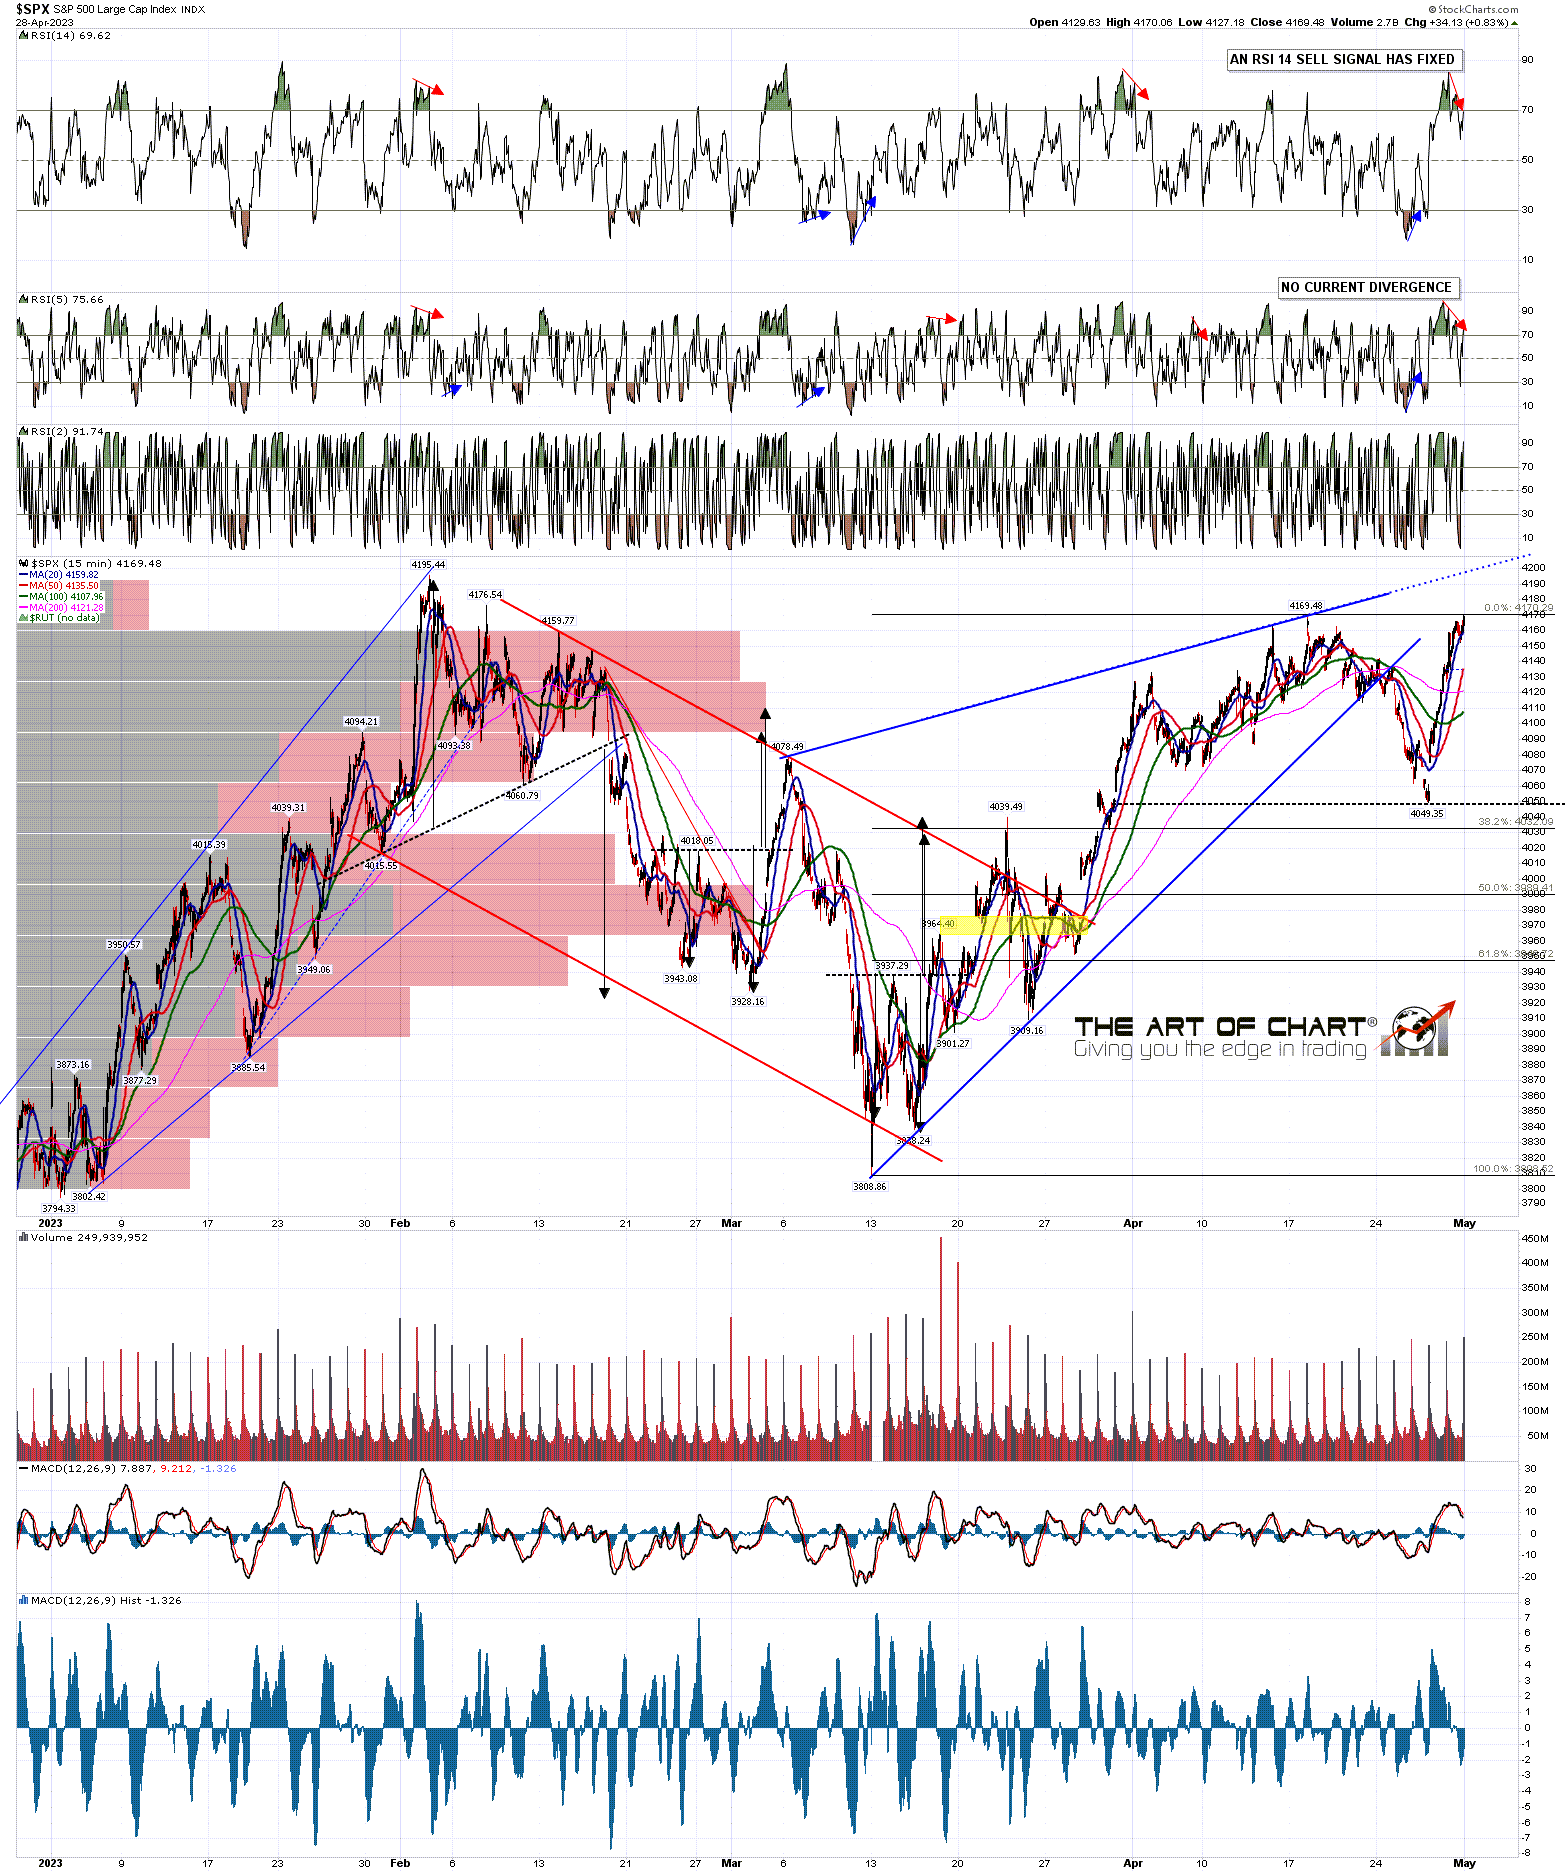
In the shorter term there is now a more modestly sized high quality double top on SPX that on a sustained break below 4049.35 would look for the 3925-30 area. There are possible RSI sell signals now brewing on the hourly charts on both SPX and ES.
SPX 15min chart:
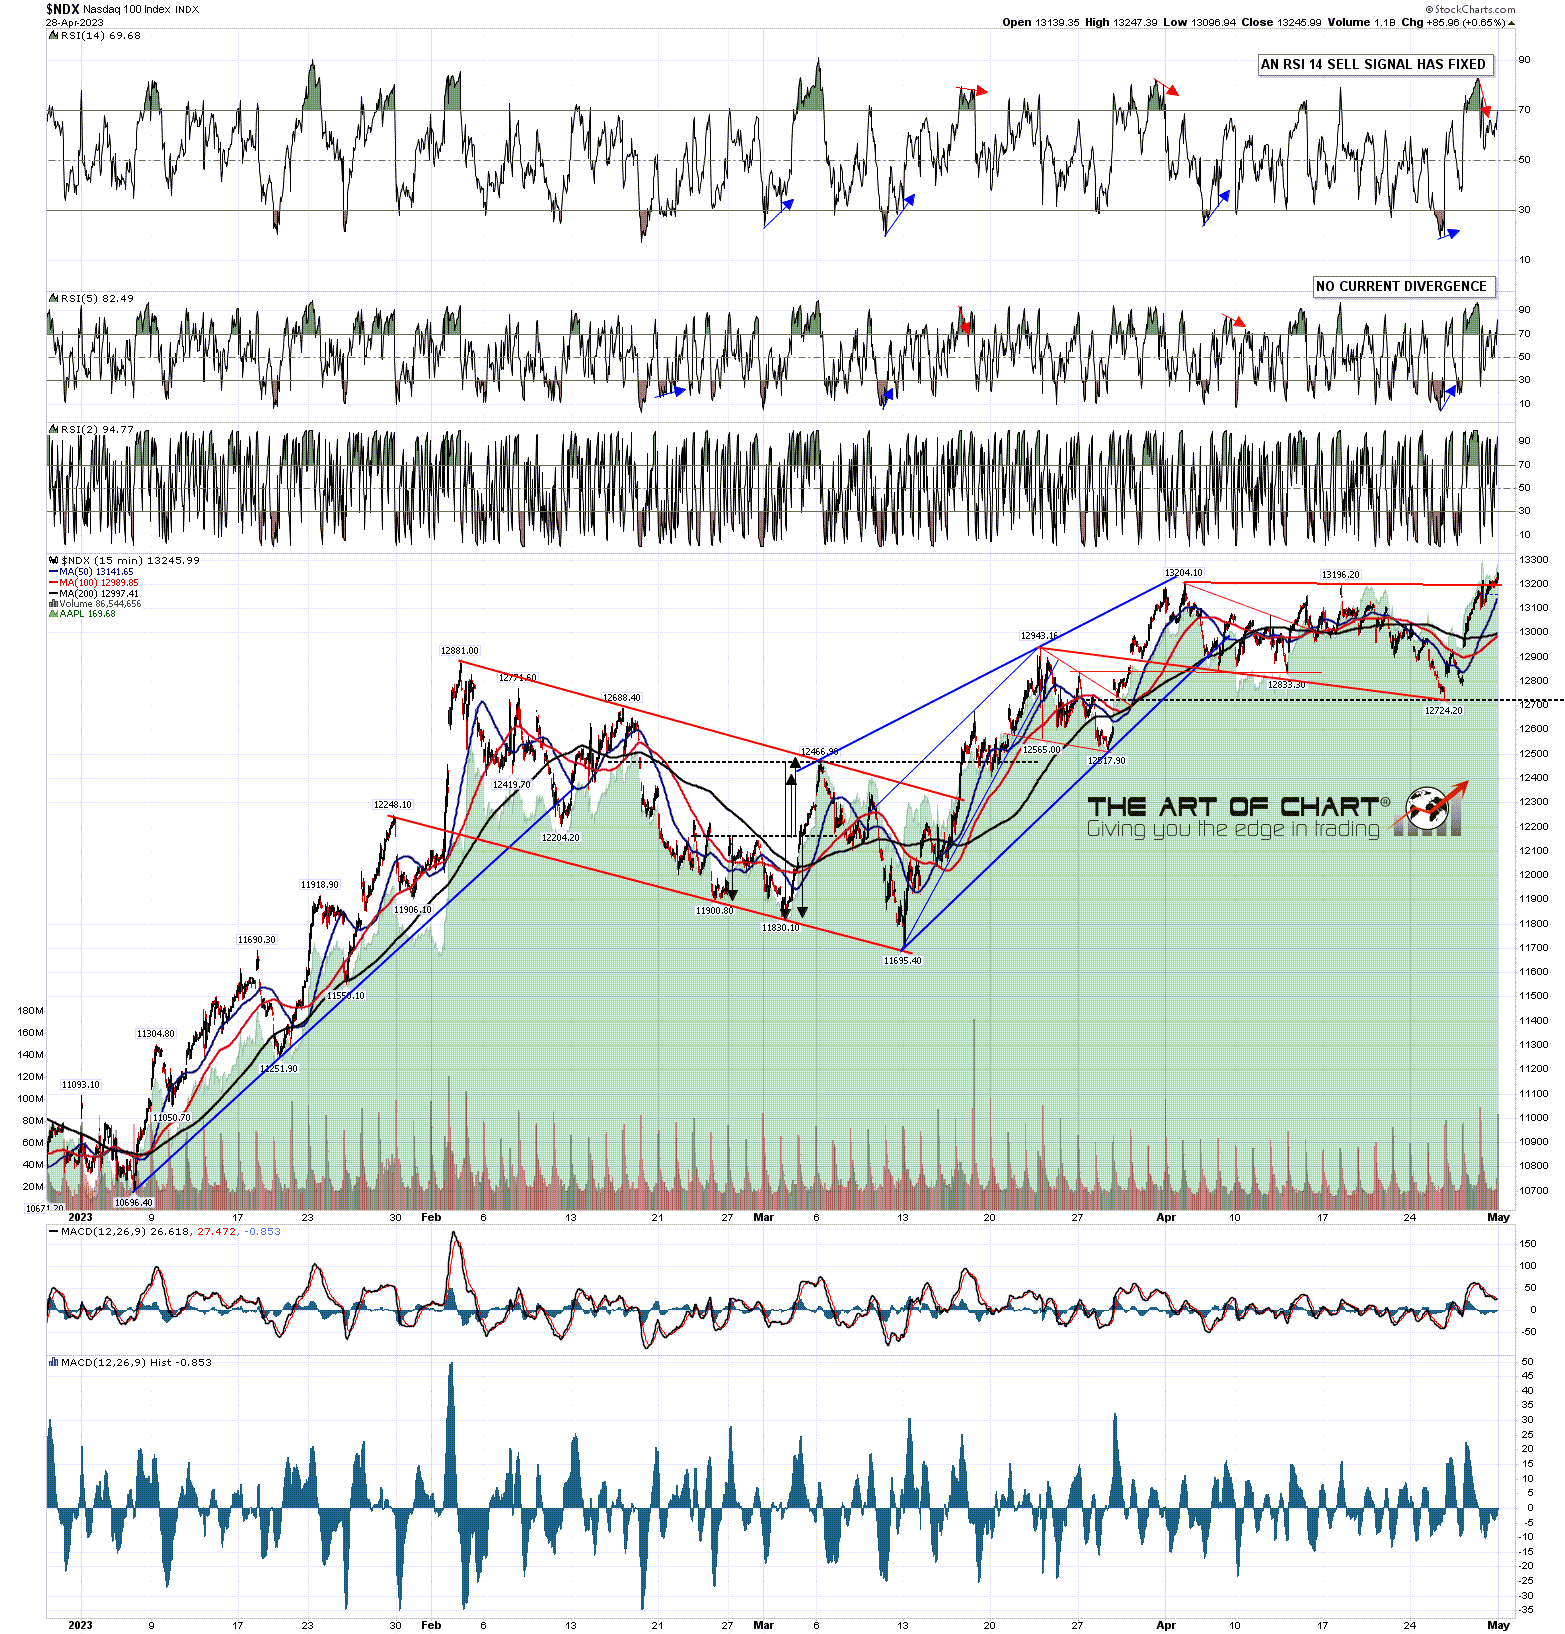
There is a matching small high quality double top on NDX that on a sustained break below 12724.20 would look for a target in the 12250 area. There are possible RSI sell signals now brewing on the hourly charts on both NDX and NQ.
NDX 15min chart:
There is a further matching small high quality double top on Dow that on a sustained break below 33.2k would look for a target in the 31.3k area. There are possible RSI sell signals now brewing on the hourly charts on both INDU and YM.
INDU 15min chart:

In the short term I think the odds are 75%+ that SPX is topping out short term for at least a decent retracement, and we now have topping patterns and negative divergence. The stats for today are 67% bullish, which is the last strongly bullish leaning day until late May. That’s just a guide of course, Friday leant strongly bearish which didn’t deliver and this may not either. Is there a chance that SPX will break up over resistance here instead of failing? Always, every good setup can always fail and go the other way, and I have assigned a probability of 25% to that, though in practical terms I think the odds of that would be more like 15% to 20%.
As this is such a nice setup, and I haven’t done one for a while, I am going to set up a modestly sized model trade for the next few months and follow it here. I entered that with 9x MES (micro-ES) just before the close on Friday at 4190. 10x MES is equivalent to 1x ES, so this isn’t a large trade, but I’m planning to trade around it on the way down.
The entry is at 4190, the target is at 3430, 760 handles below. The stop for the trade is 70 handles above at 4260 (at which point SPX would likely be breaking up), so the risk/reward ratio is slightly over 1:10, though if the trade needs to be rolled that will likely reduce a bit below that. Max risk on the trade is $3,150, and if taken off at target without the need to roll the trade will yield $34,200. We’ll see how that goes.
At 4pm EST on Sunday 7th May we are doing our monthly free public Chart Chat at theartofchart.net looking at many aspects of the equity, bond, crypto and commodities markets. If you’d like to see that you can register for that here, or on our May Free Webinars page.
If you are enjoying my analysis and would like to see it every day at theartofchart.net, which I co-founded in 2015, you can register for a 30 day free trial here. It is included in the Daily Video Service, which in turn is included in the Triple Play Service.
