I was looking at the topping setup here before the open, among other things. Full premarket video below including a very nice reversal setup on GC. Full Premarket Video from theartofchart.net – Updates on ES, NQ, RTY, DAX, ESTX50, SPX, NDX, RUT, CL, NG, GC, SI, HG, ZB, KC, SB, CC, ZW, ZC, ZS, DX, EURUSD, USDJPY, USDCAD & AUDUSD:
Slope of Hope Blog Posts
Slope initially began as a blog, so this is where most of the website’s content resides. Here we have tens of thousands of posts dating back over a decade. These are listed in reverse chronological order. Click on any category icon below to see posts tagged with that particular subject, or click on a word in the category cloud on the right side of the screen for more specific choices.
Retest Interruptus
I was making the argument before the open this morning that equity indices were so close to obvious resistance on NQ, RTY, DAX and ESTX50, that ES might well deliver a lower high this morning and fail hard there. So far that has delivered though this morning’s high might need a retest.
Premarket Video from theartofchart.net – Update on ES, NQ, RTY, DAX, ESTX50, SPX, NDX, RUT, CL, NG, GC, SI, HG, ZB, DX:
Topping Out …… Probably
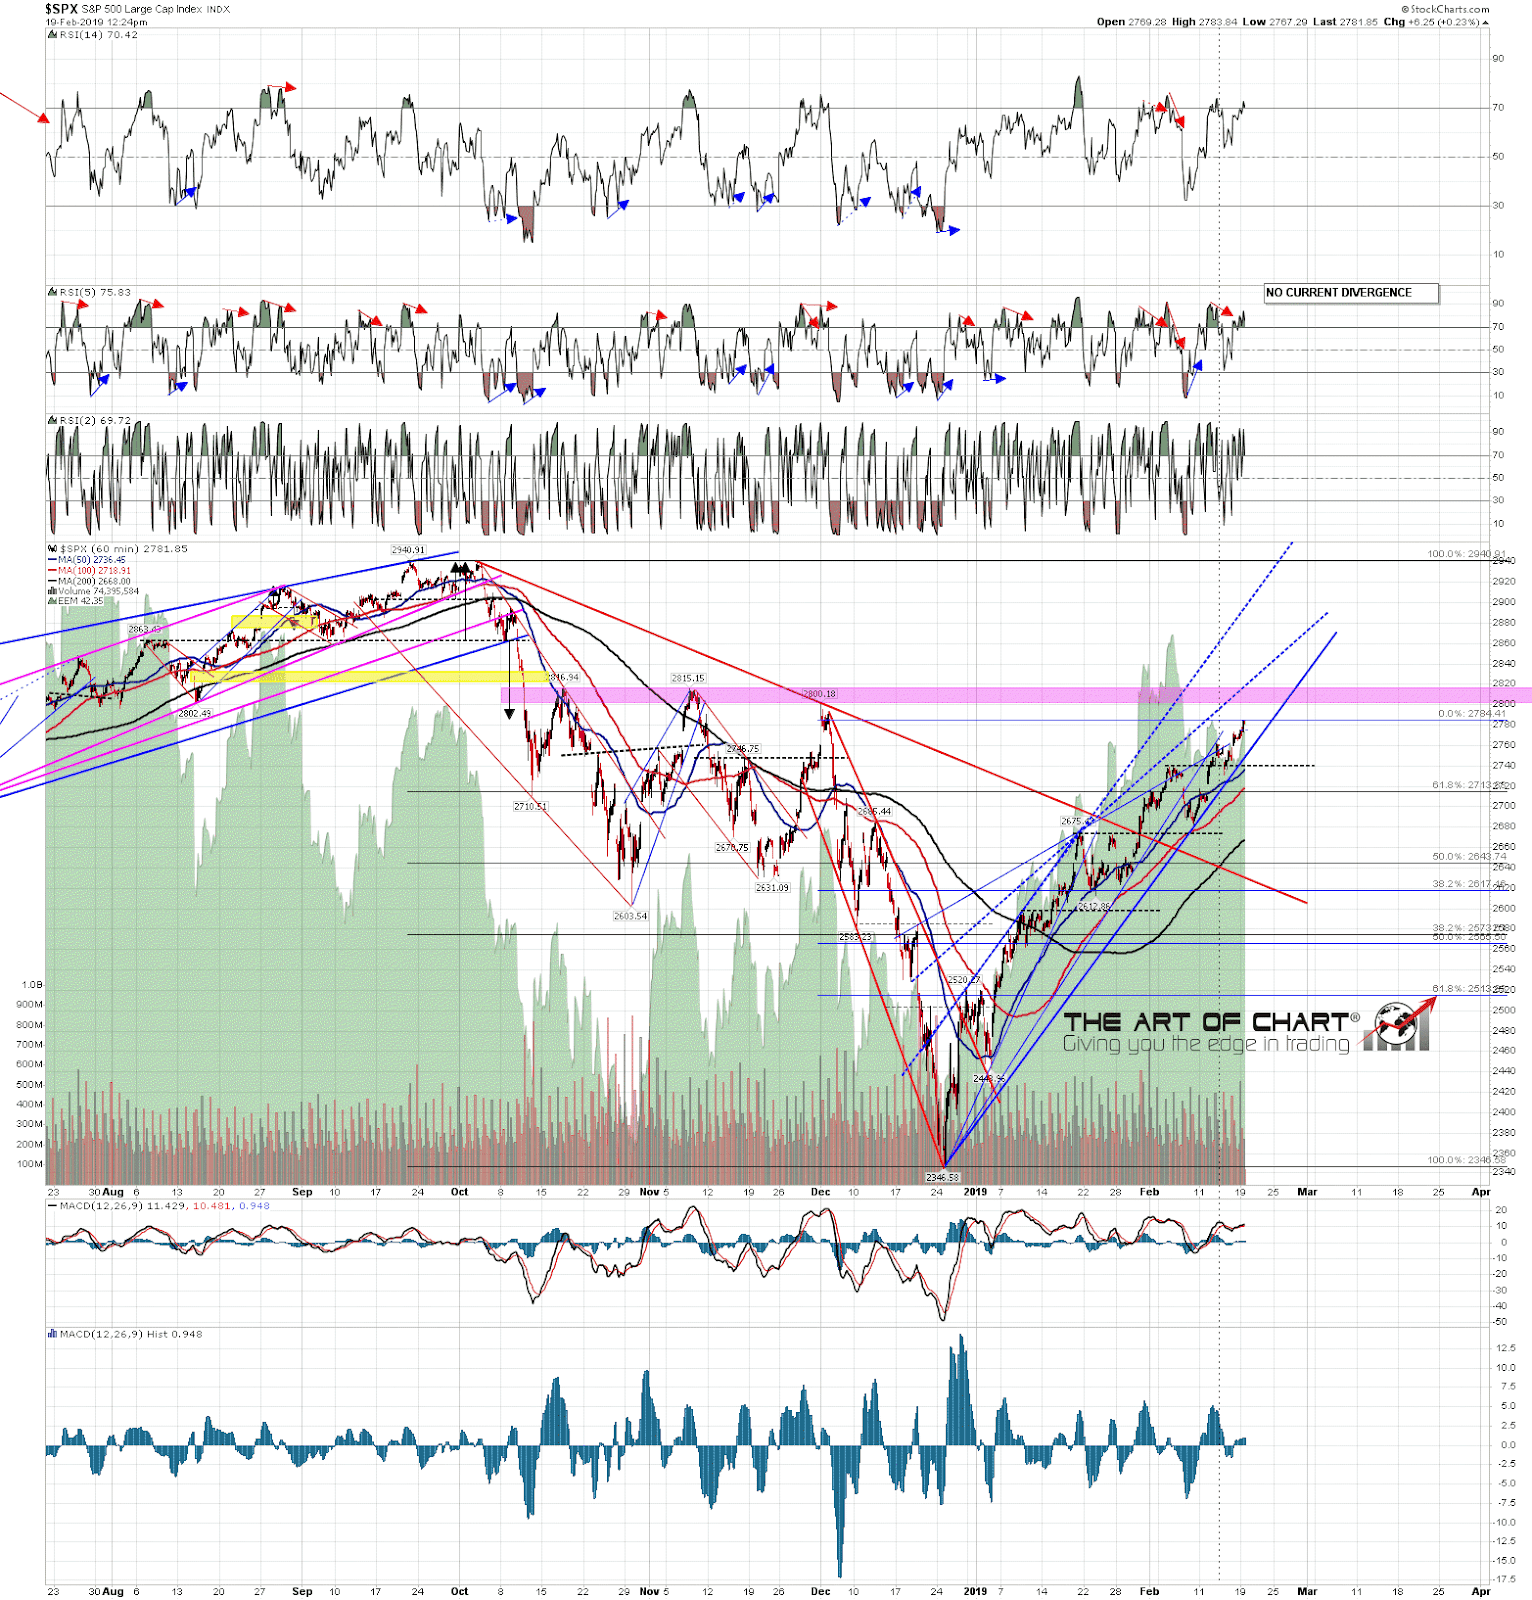
SPX and NDX reached the resistance areas that I was looking at and may be topping out there, the rising wedge support trendlines on SPX, NDX and RUT have all now broken down. So what now?
Well on SPX I have been watching three levels which are all currently in the same area. These are the SPX weekly pivot at 2784, the 50 hour MA now at 2787 and the 5dma now at 2790. What I was looking for this morning was a break down through these, which we saw, then a backtest into those as resistance which failed in that range. That we did not see, and I’m wondering whether we are going to see a high retest next to set up the second high of a small double top. SPX is still on a 60min RSI 14 sell signal with a possible daily RSI 5 sell signal brewing.
(more…)SPX Rising Channel Support Broken
I was looking this morning at the decent looking possible rising wedge resistance trendline established on SPX at the highs this week and watching with great interest as rising channel and now possibly wedge support was tested again this morning. The trendline held on the first test and then broke on the second, so there has now been a significant technical break down, and the door is open for a possible significant retracement on SPX/ES. We shall see what develops.
In the short term there is an open 60min RSI 14 sell signal that fixed yesterday, the 50 hour MA is at 2763/4, tested and the low today, and short term daily close support/resistance is at 2771. If SPX is topping out short term that we may see a high retest to set up the topping pattern for a larger retracement. (more…)
Fine Charts and Great Coffee
If you read my post on Friday talking about the rising channel on SPX that could deliver an all time high retest within weeks, then you know what I see as the key support level on SPX and that is of course that rising channel support trendline, now in the 2750 area and rising at about 42 handles per week. Until that breaks there’s really not much to talk about on the short side on equity indices.
I would note the resistance area above that is the last really significant resistance area before a retest of the all time high. That area is the ceiling established by three rallies Oct-Nov last year and those three highs were all in the narrow range 2800-17. A break and conversion of that area clears the way for the possible all time high retest that may be coming soon, and SPX is now getting close to retesting 2800.
SPX 60min chart: