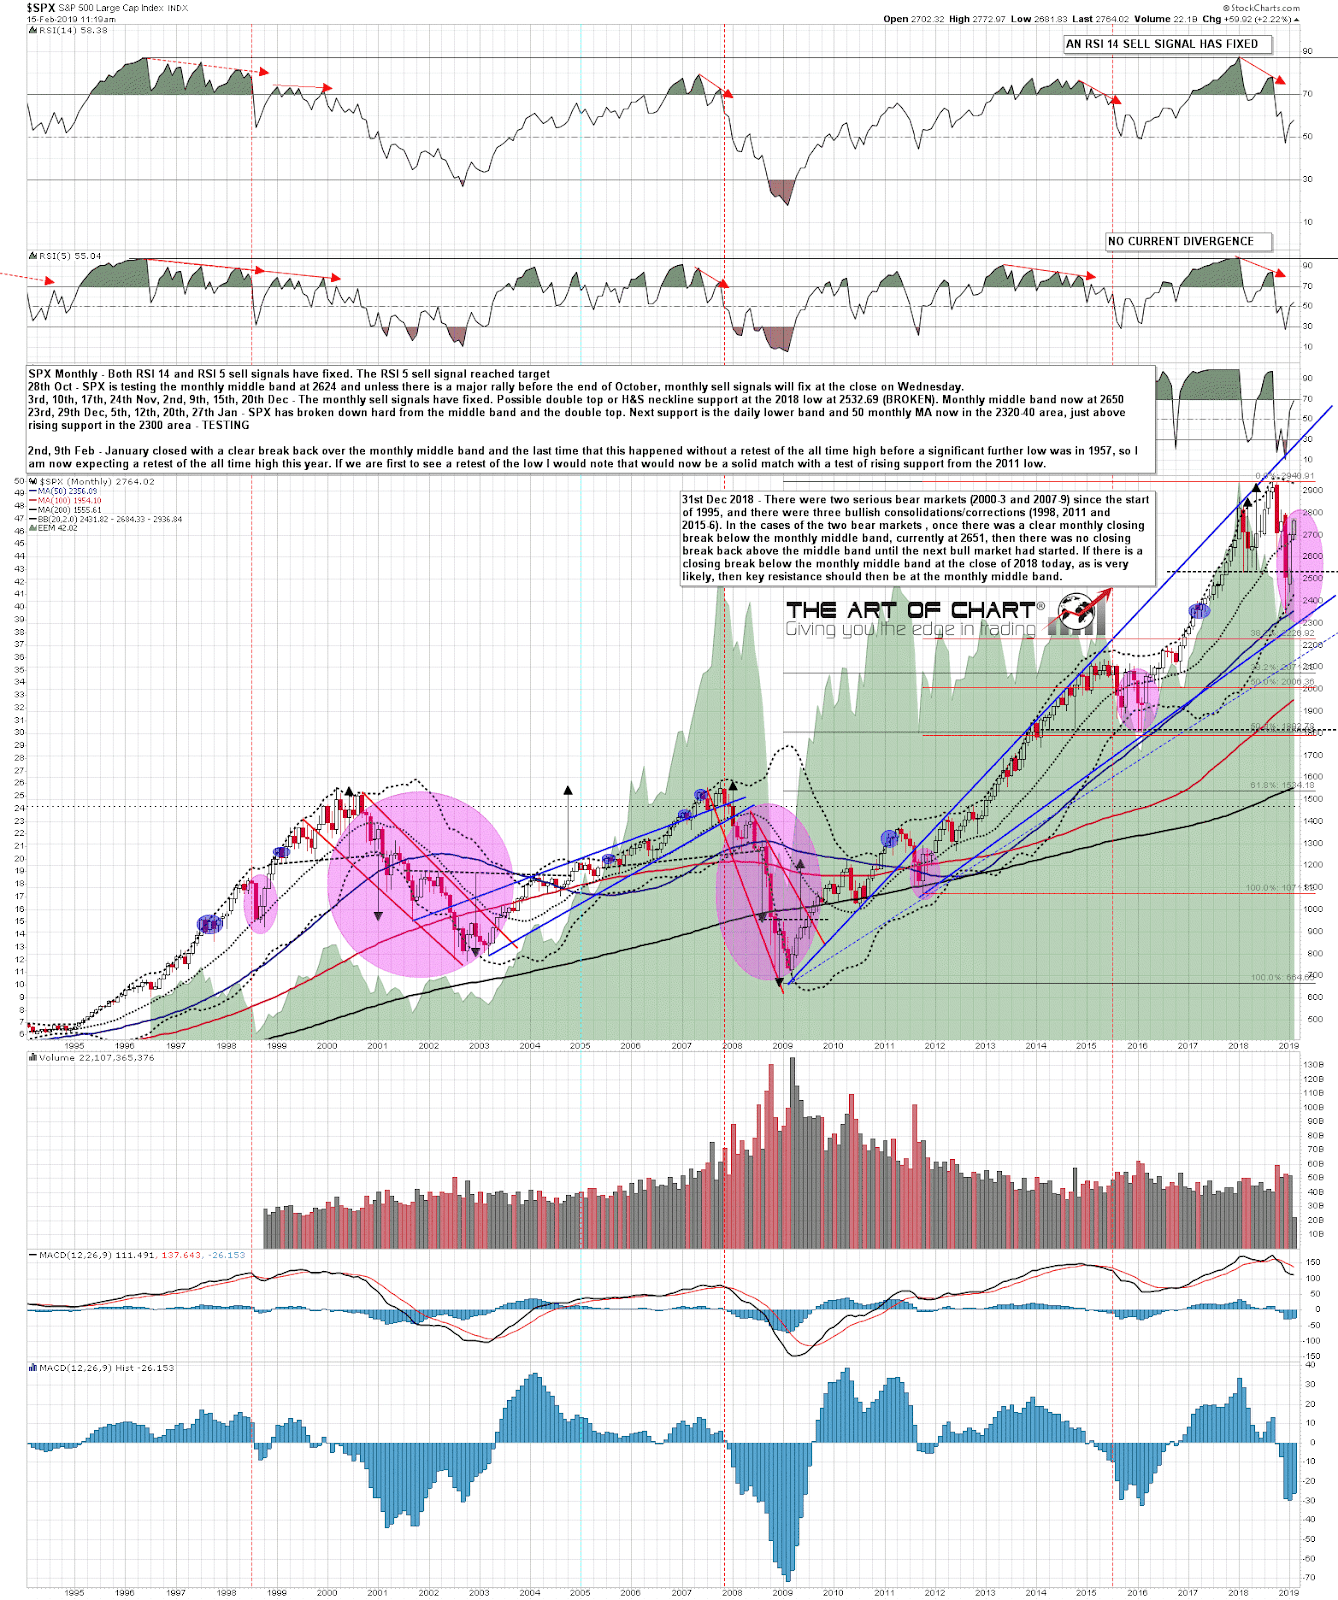
Slope of Hope Blog Posts

Slope initially began as a blog, so this is where most of the website’s content resides. Here we have tens of thousands of posts dating back over a decade. These are listed in reverse chronological order. Click on any category icon below to see posts tagged with that particular subject, or click on a word in the category cloud on the right side of the screen for more specific choices.

Bear Flags and SPX Pivot

By -

In the video below before the open this morning I looked first at the clear bear flag rally patterns developed on ES, NQ, RTY, DAX and ESTX50, then SPX, NDX and RUT. That’s a lot of bear flags and while these don’t always break down, they usually do and the odds favor that again here. None of these have broken down yet apart from a slight break on ES rising wedge support, and if we see confirmation with a break and conversion of the ES weekly pivot at 2572.50 to resistance today or tomorrow then I’d expect all of these bear flags to start breaking down with likely minimum targets at a retest of last month’s low. Full Premarket Video from theartofchart.net – Updates on ES, NQ, RTY, DAX, ESTX50, SPX, NDX, RUT, CL, NG, GC, SI, HG, ZB, KC, SB, CC, ZW, ZC, ZS, DX, EURUSD, USDJPY, USDCAD & AUDUSD:

(more…)

So Far, So Good

By -

Stan and I did an educational webinar at theartofchart.net yesterday after the close on trading in bear markets, and we were talking then about ES/SPX being at an inflection point where on a conversion of the ES weekly pivot at 2441 to resistance ES would likely head down directly into the low retest, but if decent support was found there ES should reject into a retest of the rally high and ideally head for a target in the 2550 area. You can see a recording on that webinar on our January Free Webinars page.

(more…)

Goodbye To 2018

By -

Stan and I did our end of year webinar yesterday looking at the outlook next year for equity markets including SPX, NDX, RUT, DAX & NIKK, also AMZN & AAPL, bonds, oil, gold, silver, gdx, us dollar, EURUSD, coffee, sugar, wheat, corn, bitcoin and a couple of other instruments we were asked about that I can’t recall offhand. It is well worth watching and the recording is posted here. Our annual holiday sale on annual memberships also ends on Wednesday 2nd January and if you’re interested, you can find the page for that here.

(more…)

Looking Into 2019

By -

At the weekend in Chart Chat I was talking about the 2300-50 support area on SPX, and the current rally has started from there. That area is composed of the monthly lower band and the 200 week MA, both in the 2350 area, the 50 month MA at 2330, and rising megaphone support from the 2011 low now in the 2300 area. That is a formidable support area and, if broken, could open a direct move to the double top target area 2120-2200. If it holds that would be the obvious area to end the wave A move down from the high and start the wave B rally. If we see a retest of the lows after this rally ends then that could well be a double bottom setting up for the wave B rally. SPX weekly chart:

(more…)

Big Support Breaks

By -

After repeated tests where it held, the thrust down after the Fed hike on Wednesday broke down through the big support level and potential H&S neckline in the 2530-40 SPX area  and continued down. Wednesday night I was looking at the next big level on ES 2465-80 area and that too has broken yesterday. I’d be surprised not to see a strong counter-trend rally on SPX soon but it’s getting harder to identify where the next decent support might be.

(more…)