Slope of Hope Blog Posts

Slope initially began as a blog, so this is where most of the website’s content resides. Here we have tens of thousands of posts dating back over a decade. These are listed in reverse chronological order. Click on any category icon below to see posts tagged with that particular subject, or click on a word in the category cloud on the right side of the screen for more specific choices.

Will Japan & China Lead Markets Back Up?

By -

How strong is Japanese influence on U.S. markets?

Will the Shanghai Index regain strength on Monday?

Without U.S. markets opening until Tuesday, we may see an attempt by Japan’s Nikkei Index and China’s Shanghai Index to bounce somewhat. It may not become clear until Tuesday’s close as to the potential strength of any sustainable rally in these Indices, along with the S&P 500 Index. Furthermore, there are quite a lot of economic reports being released on Monday for Japan and China, which may influence Tuesday’s trading.

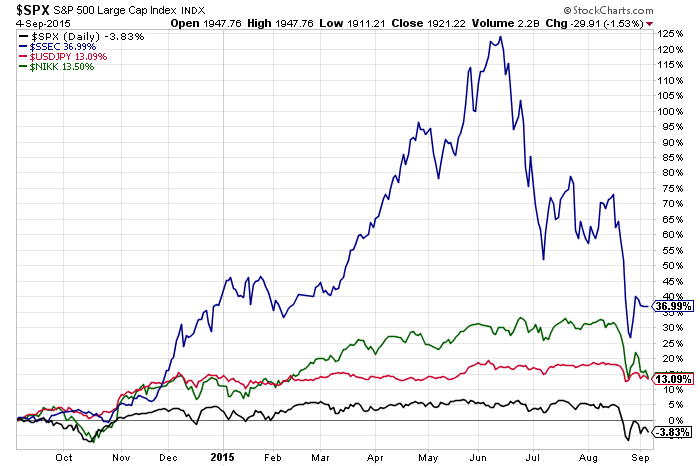
I’d keep a close eye on these three Indices, along with the USD:JPY forex pair, which have all traded lock-step (as shown on the following 1-Year Daily comparison chart), as to which direction the next (sustainable) breakout will occur.

Higher Prices in Store for Crude Oil?

By -

The last three day’s candle pattern on WTIC Crude Oil could very end up being a “Three White Soldiers” pattern, which is, technically, bullish [Definition (courtesy of StockCharts.com): “Three White Soldiers: A bullish reversal pattern consisting of three consecutive white bodies, each with a higher close. Each should open within the previous body and the close should be near the high of the day.”]

“Three White Soldiers” candle pattern

(more…)

What’s Still “UP” on the Year?

By -

After the market pullback that we’ve seen, of late, I thought I’d simply post the following Year-to-Date percentage-gained/lost graphs of a variety of world markets, to illustrate (at a glance) which ones are still “up” on the year (as of their close on Wednesday, August 26th)…presented without individual comment.

They can be monitored to see if they strengthen or weaken over the coming days/weeks, as a possible gauge of general sentiment for the remainder of the markets, particularly, those markets that have lost the most ground this year. (more…)

SPX:VIX Ratio At The Brink

By -

* N.B. See Friday’s UPDATE below…

Thursday, August 20th:

Note the aggressive selling on the SPX when the SPX:VIX ratio gets up to the 180 level. A drop and hold below the 100 major support level could spell big trouble for the SPX and the other Major U.S. Indices.

With the Momentum indicator in a downtrend on this timeframe, I wouldn’t be surprised to see a larger pullback occur in the equity markets. Watch the 2038 level on the SPX, as mentioned in my post of August 14th, for confirmation.

SPX:VIX Monthly Ratio Chart

(more…)