
That ’70s Show
Slope initially began as a blog, so this is where most of the website’s content resides. Here we have tens of thousands of posts dating back over a decade. These are listed in reverse chronological order. Click on any category icon below to see posts tagged with that particular subject, or click on a word in the category cloud on the right side of the screen for more specific choices.
Okay, let’s take a breath. I don’t like to use ‘!’ in titles or even in articles. In fact, when I see too many of them I immediately think that someone really REALLY wants me to see their point. That said, the signal shown below is pretty important.
It’s in-month with a monstrously over-bearish bond sentiment backdrop similar to when we installed a red arrow on the chart below at the height of the Q1 2011 frenzy (cue the Bond King: “short the long bond!”). Chart jockeys are probably delivering the bad news of the chart’s inverted H&S, a potential for which NFTRH began managing a year ago when the 30yr yield hit our initial target of 2.5% and then recoiled as expected after the public became very concerned about inflation.
(more…)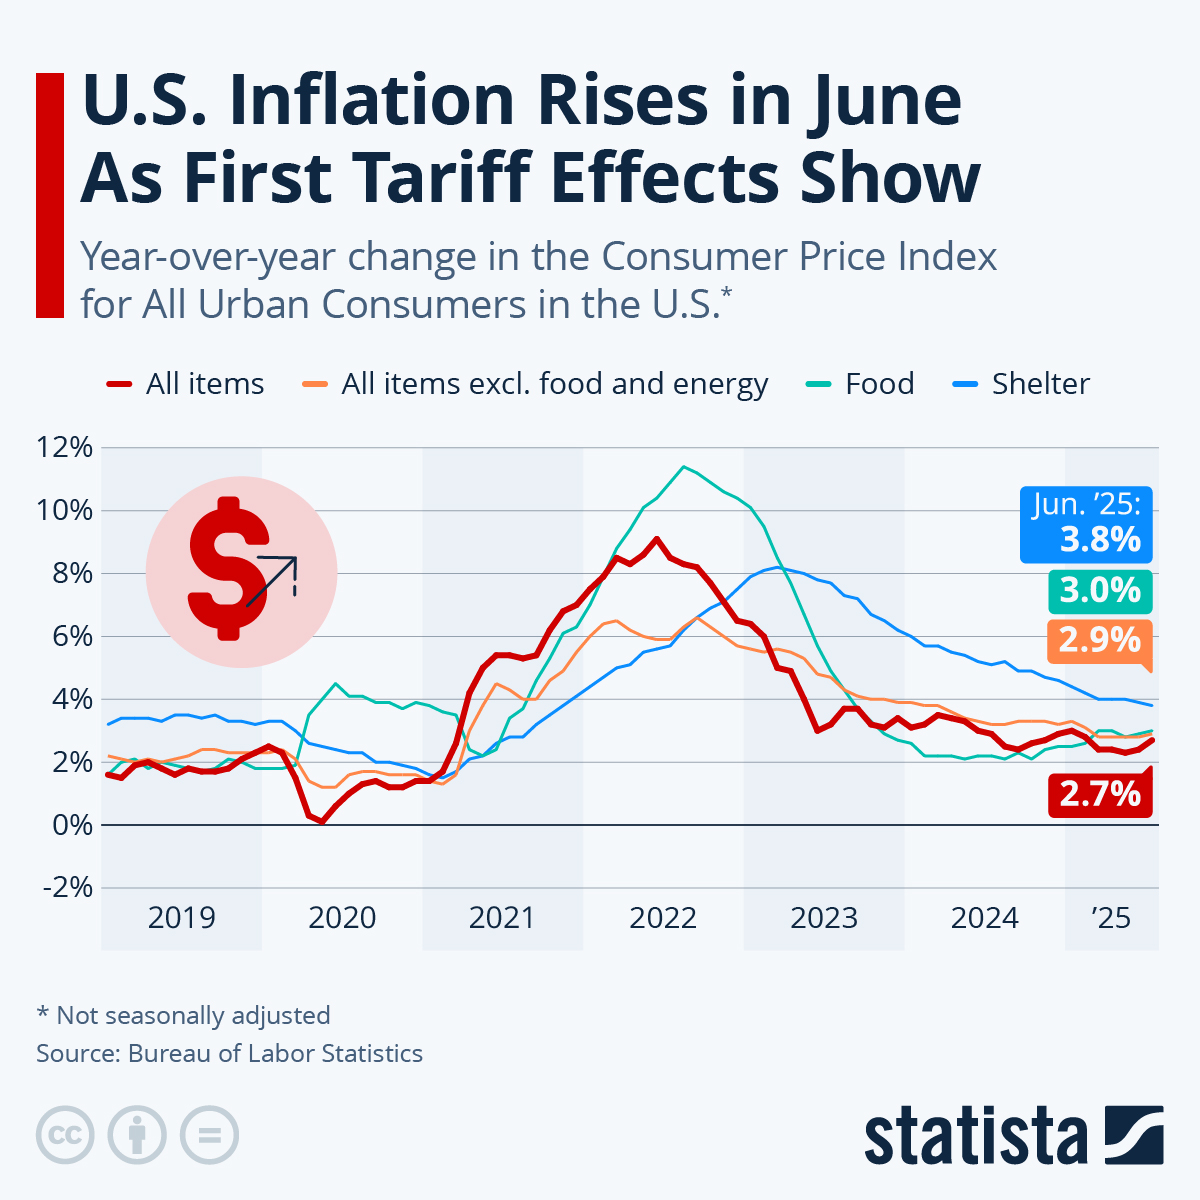
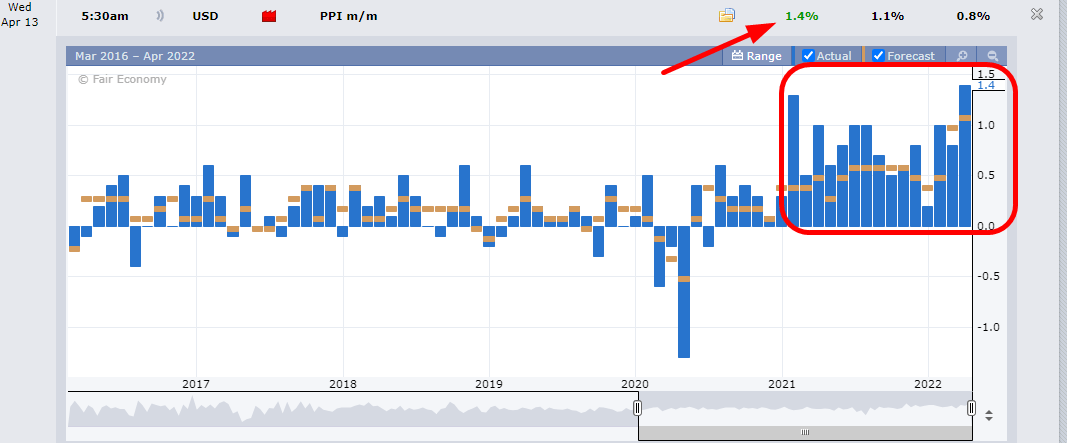
Since this is Inflation Week (and, in a way, I suspect every week for the next couple of years will be), all eyes were on this morning’s PPI number. As I am typing these words, the actual figures were just released, and it’s a scorcher.
The prior month was 0.8%. The expectation was 1.1%. The actual number (which, let’s please keep in mind, is heavily discounted from reality since the government has a vested interest in keeping it low) is 1.4%, which annualizes out to 16.8%. So, in fact, we’re probably in a 30% inflationary environment right now, thanks to the bumbling, criminal Federal Reserve.
The “extraordinarily elevated” CPI numbers hit, and they weren’t so extraordinary after all:
To be sure, inflation is heating up, but there was nothing eye-watering about the report. Here is the monthly CPI over the past six years, and you can see clearly things have changed:
(more…)