This whole cyclical bull market was either an a-b-c correction during a secular downtrend, or– if this trendline holds and prices make a new high– that changes the structure to a five wave advance!
Slope of Hope Blog Posts
Slope initially began as a blog, so this is where most of the website’s content resides. Here we have tens of thousands of posts dating back over a decade. These are listed in reverse chronological order. Click on any category icon below to see posts tagged with that particular subject, or click on a word in the category cloud on the right side of the screen for more specific choices.
Atypical Top? (by Springheel Jack)
(Preface from Tim: I mentioned in the comments section last night that if you were a bearish sort and inclined toward religion, that you should pray for a hearty rally. With the /ES up 11.50 as I am typing this, it looks like God was listening. It sounds crazy, but this is exactly what we want right now. I have many small short positions right now, but I am delighted at the push higher.)
I don't use Elliot Wave much in my own charting, but I have a couple of favorite elliot wavers who are both excellent, and they are Pug and Alphahorn. Both run subscription services with an unprotected post every so often that is always worth reading. I mention this today because Pug switched his primary scenario yesterday to a count where we are in an atypical wave 4 after the wave up from July finished in February and Alpha is also considering that count.
That count would have SPX making a wave 3 top from July last year in February, then wave A down to the March low, Wave B to the high at the end of April, then we would now be in Wave C with a target in the 1250 area sometime in June or July. There are a couple of things that I'm seeing that lend some weight to this scenario.
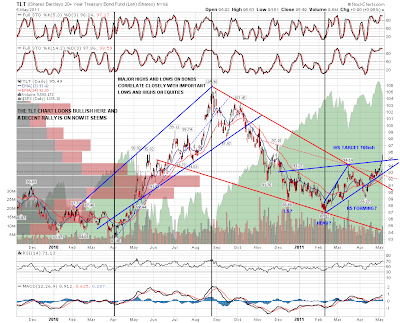
The first is the situation on bonds which generally inversely correlate closely with equities on major bottoms and tops. It's increasingly obvious that bonds made a major low in February, and I've been struggling to fit that in with what's happening on equities. Here's TLT on the daily chart where it has clearly bottomed and broken up. There is an IHS on the chart with three possible necklines and I'm taking the target as being in the 100 area:
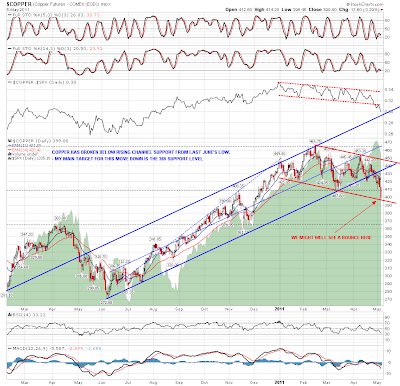
The other correlated market that has broken down is copper of course, which made a major high in February. That would also fit with a technical wave high on equities then. Here's the copper daily chart. My target on copper (larger timeframe) is 365 but you can see from the chart that it could well bounce here:
Do I buy Pug's count? It's very possible, though it isn't welcome news, as I was expecting a larger summer bear move from a higher level. Where we are now potential downside looks limited unless the bull market is over, which seems rather doubtful to me. Pug has a target in the 1250 area, and in my view this wave 4 could not go lower than about 1220, as that would break the main lower trendline for the bull market rising channel, which I'm not expecting to see broken until this bull market has made a final top. Here that is on the weekly chart, where you can also see that the most recent high came with sharp negative divergence on the weekly RSI:

Looking just at the rising channel from the July low last year, support there is in the 1300 area. There's been negative divergence on the daily chart since November last year and it's worth noting that the last SPX high hit the declining trendline on RSI exactly:

A large part of the immediate bull case was the IHS on SPX of course, and the neckline on that was thoroughly trashed yesterday. That doesn't mean that it can't play out of course, but it makes it much less likely:

Overall I think Pug's count is convincing, and I'm going to be assuming that is the case until demonstrated otherwise by a major support or resistance break on SPX. In that context the likelihood would be that we have seen a major interim top on commodities, but not a final high, and I'll be watching the key 365 level on copper to see whether it holds. The equivalent level on oil would be in the 86 area, and now that we have reached the 96 area that I called for last week at the oil double-top, I'm expecting a bounce, and then a move to test main support at 86:
My main target for this move down on ES is in the 1318-20 area today, but declining resistance has been very thoroughly tested overnight, and I'm wondering whether we see a bounce here that would probably coincide with the copper bounce that I was suggesting in the copper chart above. Declining resistance is now at 1339 and a move with any conviction above 1340 should deliver a strong bounce today. As I've been writing this the employment figures have come out and resistance is now broken so I'm assuming a bounce for today that may last into Monday.
The Past Three Years of the Silver Bears
SPY Update (by Leaf_West)
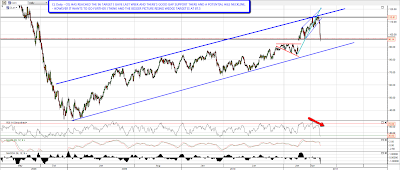
As most readers of my blog have seen with my posts in the blog and in the live chat, I have been looking for a push into the $132-$133 area as the first leg of the "B" Pattern in an ABC Zigzag correction off of the Feb 2011 highs.
For those of you unfamiliar with eSignal, the rainbow colored bar is the "MOB" target drawn by their charting software. MOB stands for Make-or-Break, and it is drawn off of pivot points using Elliott Wave Theory.
March 24th Forecast:
Current Chart:
The first leg down from the Feb top ("A" of the ABC Zigzag) was in itself a zigzag and therefore I am expecting a flat pattern for the B leg pattern. For those readers that are less familiar with this, here is what I am expecting (along with the forecast I drew on March 24th) …
March 24th Chart:
Cheers … Leaf_West Visit my Blog
Perhaps There’s Hope Now
Well, I never thought I'd see this day……….I offer the following from today's New York Times:
The last time they featured Prechter, back in July, he was calling for an incredible collapse. It turns out – – agonizingly, painfully, and horribly from my point of view – – last July was in fact a fantastic time to buy every stinking stock in sight.
Perhaps the fact that he's saying he was wrong……..which, seriously, I don't think I've ever heard from Gainesville………is a good sign. As for being prudent: prudent don't pay the bills. EWI's warnings over a year ago that silver was about to plunge compelled me to sell my 1000 oz. brick at $9/ounce. I'd rather have been imprudent and own it today at $31.
