Slope of Hope Blog Posts

Slope initially began as a blog, so this is where most of the website’s content resides. Here we have tens of thousands of posts dating back over a decade. These are listed in reverse chronological order. Click on any category icon below to see posts tagged with that particular subject, or click on a word in the category cloud on the right side of the screen for more specific choices.

Failing To Bounce (by Springheel Jack)

By -

ES fell to my first candidate H&S neckline yesterday and bounced there. That bounce hasn't been sustained so far, and I'm doubtful now about seeing much of a bounce today, though the positive divergence on the 60min RSI and CCI still looks promising. The small bounce that we have seen has has formed a stumpy right shoulder onto the potential H&S and on a conviction break of yesterday's low I'd been inclined to take it seriously if only because the next obvious targets are in the mid-1250s in any case:

There are two reasons why the mid-1250s are the next obvious downside target. The first is that the lower trendline of the big rising wedge on the ES daily chart is in the 1254 to 1256 area. The second is of course that there is a second candidate neckline for a possible big H&S located there at 1257. If that were to continue forming it would indicate to 1228 with the RS forming on a bounce from the 1257 area to about 1275. I've not marked that on this chart but it's worth bearing in mind:

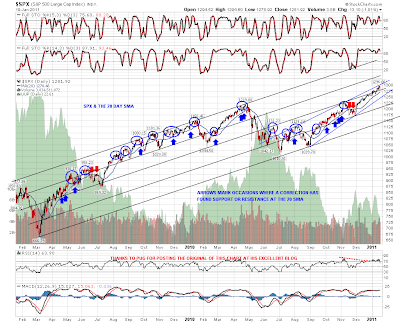
There is one other downside target worth mentioning, and that's in the 1270 SPX (1267 ES) area. That's the daily 20 SMA, which is usually touched regularly on retracements but hasn't been touched since the start of December:

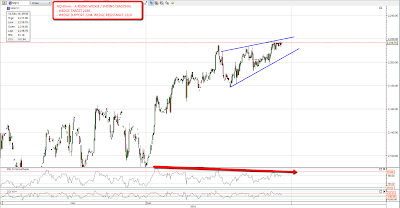
Nasdaq has  also been failing to bounce overnight and if we see a further move down today the obvious target is the lower trendline of the megaphone in the 2260-5 area:

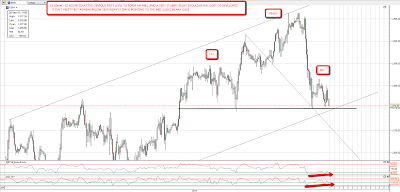
I've been reading a lot about the EURUSD break up through resistance this week and the general view seems to be that it will rise further in the near future. That could be right of course, but I'm leaning towards the view that EURUSD has made a short term top and will retrace to the 1.32 area. I have two main reasons for thinking that, and I could be wrong, but they are as follows. Firstly EURUSD has broken down yesterday from a rising wedge which appears to be a wave 5 ending diagonal. I've marked a wave count on the chart and the rising wedge target is 1.325. Secondly I have a nice looking, though still unproven, rising channel with the lower trendline in the 1.32 area. EURUSD has recovered most of yesterday's losses overnight and we'll have to see whether it can make a new high from here. I hope not, as a retracement on equities will be much easier going with a falling Euro:

I'd expected to be leaning long today but after looking at the charts this morning I'm still leaning short. There's a good chance we'll break 1260 ES today in my view. If so we should bounce at one of the targets not far below it.

Ending Diagonals (by Springheel Jack)

By -

I don't know whether this is the top but I think it might well be. I'm not expecting to see any serious falls before January in any case but I think this might well be as high as SPX and Nasdaq go. After not seeing much in the way of channels or patterns on the latest spike up we finally have some very nice rising wedges or ending diagonals from the last low. These are generally a fifth wave formation so for these to appear at a point where we're looking for the final move up is significant. Here it is on ES:


Here it is on Nasdaq:

Everything looks right for a top here. Silver has made a top at the right place and copper is in the right area too. Numerous 'risk-on' markets have failed to make new highs. EEM particularly appears to have topped in November which is interesting as it doesn't generally show negative divergence at tops, though it usually shows positive divergence at bottoms. Other 'risk-on' markets like Brazil that do generally show negative divergence at tops are also showing it now though, so EEM is just giving additional confirmation:

SPX:Vix has been in a rising channel since June and has made a high in the right area:

Most importantly of all USD has been consolidating and looks ready for another move up. A rising channel has formed on the daily chart that looks solid:

Pug's calling a likely wave 1 top here, and I'm joining him. We might see a marginal new high within the rising wedges today but what I'm expecting now is that we see a first wave down this week, see a second wave retracement back up over the Xmas period, and start the third wave of A in early January.

Equities Down, Dollar Up (by Springheel Jack)

By -

We saw the first significant retracement on equities yesterday, and there is an argument that it has already finished. My provisional channel on NQ makes that argument well:

I think that there's probably more retracement coming however and I have an alternate channel that I will be using as soon as support breaks on the current one:

For the second channel I have a matching channel on ES with a now very well demonstrated resistance trendline:

I have a number of things that I'm looking for at the end of this wave 5 of 1 move up. The upper trendline of the rising wedge on ES should be hit, and I have another on IWM where I'm looking for a hit of the upper trendline as well:

I'm also looking for negative divergence on RSI from the November high on the SPX daily chart, which looks likely as long as the high is in the 1250 – 1260 area. Ideally there would also be a failure to match the November high on EEM, the emerging markets ETF, which has been lagging badly on this move up, and an uptrend in USD, which has been a significant concern in the last few days. That would be a very nice setup for a decent wave 2 retracement on equities in the first months of next year.

I was very encouraged to see USD break back up through the important 80.1 area yesterday with a nice move on EURUSD below 1.32. I've marked a provisional broadening ascending wedge on the DX chart, though it would need a hit and reversal at the top trendline to confirm it. A new low on EURUSD in the near future would be very encouraging:

A lot of commodities are testing long term resistance trendlines at the moment. One I watch particularly carefully is silver, which hit the 30.6 target of the big IHS with the neckline at 19.5 yesterday, and also hit the long term resistance trendline at the same time. There was a strong reversal at that level and it's very possible that we've just seen a major interim top in silver that will last several months at least, and that would be very encouraging for an equities reversal at the same time:


It is possible of course that we have just seen the wave 5 top, and that is Pug's alternate count on his EOD write-up yesterday which you can see here. His primary count has us in the 4th wave of this wave 5 up though, and that fits better with what I'm seeing. Another final wave up into the 1250 – 1260 area would reach the SPX IHS target and also ideally reach the upper trendline of the SPX rising wedge for an ideal short entry. Pug notes however that we've now reached a level where longs need to be cautious and I think that's right. His target for this retracement is 1212 SPX in an ABC retracement where we are now in wave B, and that fits my ES rising channel if we take a couple of days to reach it.