Slope of Hope Blog Posts

Slope initially began as a blog, so this is where most of the website’s content resides. Here we have tens of thousands of posts dating back over a decade. These are listed in reverse chronological order. Click on any category icon below to see posts tagged with that particular subject, or click on a word in the category cloud on the right side of the screen for more specific choices.

Equities Down, Dollar Up (by Springheel Jack)

By -

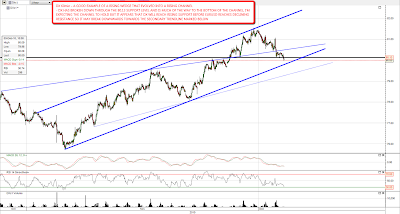
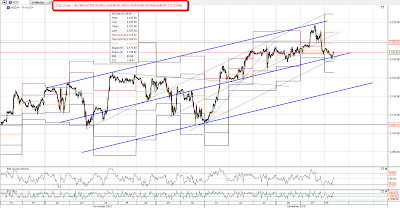
We saw the first significant retracement on equities yesterday, and there is an argument that it has already finished. My provisional channel on NQ makes that argument well:

I think that there's probably more retracement coming however and I have an alternate channel that I will be using as soon as support breaks on the current one:

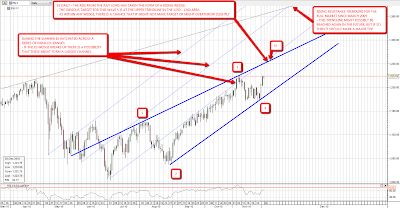
For the second channel I have a matching channel on ES with a now very well demonstrated resistance trendline:

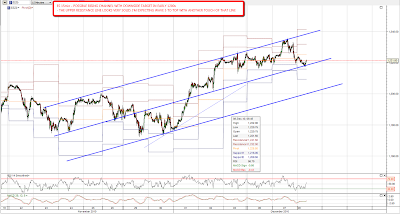
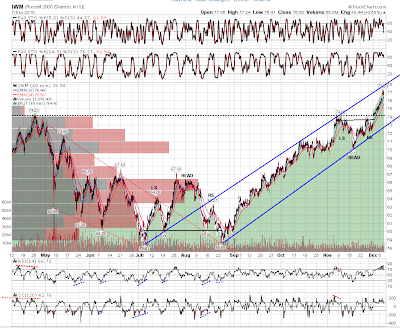
I have a number of things that I'm looking for at the end of this wave 5 of 1 move up. The upper trendline of the rising wedge on ES should be hit, and I have another on IWM where I'm looking for a hit of the upper trendline as well:

I'm also looking for negative divergence on RSI from the November high on the SPX daily chart, which looks likely as long as the high is in the 1250 – 1260 area. Ideally there would also be a failure to match the November high on EEM, the emerging markets ETF, which has been lagging badly on this move up, and an uptrend in USD, which has been a significant concern in the last few days. That would be a very nice setup for a decent wave 2 retracement on equities in the first months of next year.

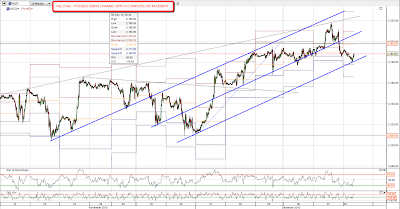
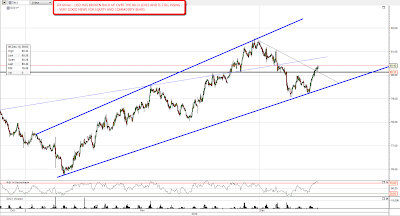
I was very encouraged to see USD break back up through the important 80.1 area yesterday with a nice move on EURUSD below 1.32. I've marked a provisional broadening ascending wedge on the DX chart, though it would need a hit and reversal at the top trendline to confirm it. A new low on EURUSD in the near future would be very encouraging:

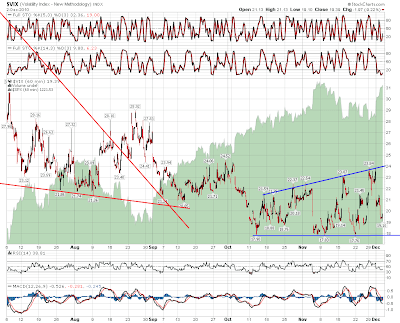
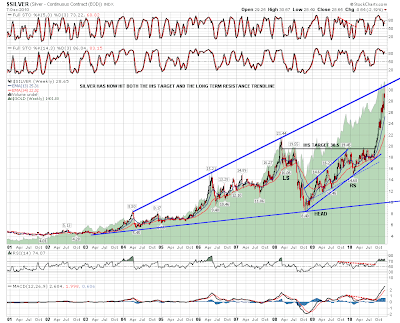
A lot of commodities are testing long term resistance trendlines at the moment. One I watch particularly carefully is silver, which hit the 30.6 target of the big IHS with the neckline at 19.5 yesterday, and also hit the long term resistance trendline at the same time. There was a strong reversal at that level and it's very possible that we've just seen a major interim top in silver that will last several months at least, and that would be very encouraging for an equities reversal at the same time:


It is possible of course that we have just seen the wave 5 top, and that is Pug's alternate count on his EOD write-up yesterday which you can see here. His primary count has us in the 4th wave of this wave 5 up though, and that fits better with what I'm seeing. Another final wave up into the 1250 – 1260 area would reach the SPX IHS target and also ideally reach the upper trendline of the SPX rising wedge for an ideal short entry. Pug notes however that we've now reached a level where longs need to be cautious and I think that's right. His target for this retracement is 1212 SPX in an ABC retracement where we are now in wave B, and that fits my ES rising channel if we take a couple of days to reach it.

Wave 5 Targets (by Springheel Jack)

By -

We've seen enough in the amazing move up in the last two days to establish in my view that a powerful new wave up is in progress. I'm not actually expecting it to get a lot further than this, though there is obviously a risk that it will. My current view is based on two main assumptions. The first assumption is that this is a wave 5 move of whatever degree, and that seems reasonable from even a glance at the action since the July low. The only two EW bloggers that I read on a regular basis, Pug and Alphahorn, both think so too. The second assumption is that USD is now in an uptrend and while there's every technical reason to think so, it could be that assumption is mistaken. We shall have to see whether USD holds or folds after the current retracement reaches target, and if it folds, we might see a lot more upside than I'm currently expecting.

On USD the retracement is well advanced and the important support level at 80.13 has been broken. Channel support is marked on the 60min chart and an alternate support trendline if channel support is broken as I'm seeing that USD and EURUSD are slightly out of sync, and if EURUSD is to reach declining resistance, USD may have to break the obvious rising support:

Taking a fresh look at the a move from the July low, it now seems obvious that ES is in a rising wedge and that the obvious target for this wave 5 move is at the upper trendline of that rising wedge in the 1250 to 1265 area, depending on when it is reached. I've added in some other trendlines to the chart that are worth noting if that level is exceeded:

In terms of shorter term charts, I'd have more to work with if we had seen a significant retracement on the way up so far, but I've done my best with what is available. All my wave 4 channels and patterns have now broken and looking at the action since the low I'm seeing rising wedges on both ES and NQ that I'm expecting to broaden into rising channels. I've marked the alternate trendlines for a break up or down from the wedges, and I'm favoring a break downwards at the moment. Here's the rising wedge on the ES 15min chart:

Here's the rising wedge on the NQ 15min chart:

I've posted the right angled and ascending broadening formation on the Vix 60min chart a few times before, and it has been a very good performer over the last few weeks. I am watching the current move down on Vix carefully to see whether the pattern breaks to the downside. If it does that may well indicate that my relatively modest equities wave 5 scenario here is in trouble. Vix closed at 19.39 yesterday and strong support is in the 17.75 to 18 area:

Georgia On My Mind

By -

As I gaze upon SLV's closing price of $27.15, my thoughts turn to practitioners of the Elliott Wave "theory" (and I do mean "theory") and their urgent pleadings many moons ago to dump silver when it was eight bucks an ounce.

As a form of therapy, I suggest a brief pause here on Slope to indulge ourselves in some traditional 5-7-5 haiku. I'll begin with my own trio, and I look forward to yours……

Ever-surging stocks
All predictions rendered moot
Wave 3, anyone?

When projections fail
Just call it an extension
Who's to say you're wrong?

Random counts and waves
Thirteen possible next moves
Who profits from this?

1108-bearhaiku

The PUG View

By -

I've obviously been pretty embittered about the entire world of EW, but one fellow – Pug – seems to have the admiration of most Slopers, and I'm checking his work out more and more frequently.

He kindly has indicated that I am welcome to share images from his site, which I appreciate. If I understand him correctly, he is looking for a drop on the /ES to ~1135. Considering the hellfire and brimstone we were discussing many moons ago, this sounds like bread crumbs, but at this point, I'm sure the bears would be positively ecstatic at even this modest a drop.

I should hasten to add that Pug sees this as simply one step toward about ~1250 on the S&P. The reason I find all of this so interesting is that it actually agrees beautifully with my own analog. The nominal prices are a little higher, but the "form" of the pattern is exactly the same.

1025-pug