A week or two ago, I overlaid the sine wave from SlopeCharts onto the chart of natural gas. Interesting how it seems to be working so far! This suggests much lower prices in the months ahead.

Slope initially began as a blog, so this is where most of the website’s content resides. Here we have tens of thousands of posts dating back over a decade. These are listed in reverse chronological order. Click on any category icon below to see posts tagged with that particular subject, or click on a word in the category cloud on the right side of the screen for more specific choices.
A week or two ago, I overlaid the sine wave from SlopeCharts onto the chart of natural gas. Interesting how it seems to be working so far! This suggests much lower prices in the months ahead.
I am pleased to announce a new feature in SlopeCharts for all paying members (and, nudge nudge, prices are going up next Friday, so those of you on the fence might want to make the leap). If you think of any other genuinely helpful classes of “events”, please do email me, since I’d love to have as helpful a library of dates as possible.
Now, there is a library of date-based “events” built into SlopeCharts which subscribers can overlay on top of a chart. These events include holidays such as Memorial Day and Christmas as well as events from the world of finance such as FOMC announcement days. You can access this feature from the Tools menu:
(more…)As most of you know, SlopeCharts is the crown jewel of the Slope of Hope, and it is the only charting product I use. Let’s face it, though – – none of us are getting any younger, and sometimes the data line and the axis labels can be difficult to read.
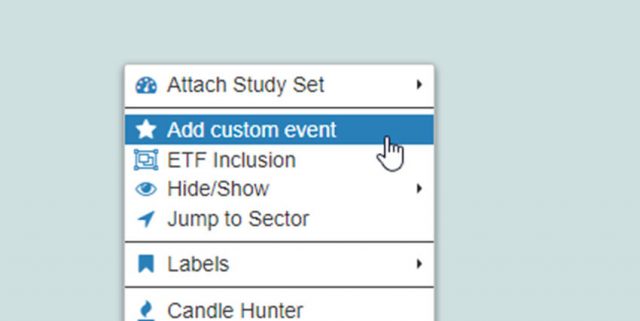
I am delighted to announce a new feature in SlopeCharts that I dreamed up a few days ago; Custom Events.
This feature allows you to add a marker to any part of a chart with a note in it. The note might pertain to the stock (“Elon Musk announces intention to buy Twitter“) or earnings (“Big earnings disappointment“) or news (“Hurricanes shut down refineries and push up energy prices“) or anything you like (“Bought my first 50 shares on this day.”) You can make any note about anything you chart on any particular date, and it will be remembered for your later reference.
To add a custom event, just right-click on the chart on whatever date is appropriate for your note, and choose this from the pop-up menu: