IN FED LANGUAGE, PRICE STABILITY MEANS A BLOW OFF TOP
Call it QE II, monetization, printing, or the precursor to QE III, call it what you like but just don't fight it. The FED's overt action to inflate asset prices at any cost have trumped all market fundamentals and created an asset price surge into the stratosphere. Chairman Bernanke states that he wants price stability, yet his definition of price stability must not include a normal ebb and flow, it must only include a moonshot ramp job. I would contend that we have anything but price stability at the current moment.
I've captured a few sentences from Fed Governor Mishkin in a 2007 speech. In this message he highlights the dual mandate that the Federal Reserve has in its role.
"According to this legislation, the Federal Reserve's mandate is "to promote effectively the goals of maximum employment, stable prices, and moderate long-term interest rates." Because long-term interest rates can remain low only in a stable macroeconomic environment, these goals are often referred to as the dual mandate; that is, the Federal Reserve seeks to promote the two coequal objectives of maximum employment and price stability. In the remainder of my remarks today, I will describe how these two objectives are consistent with our ultimate purpose of fostering economic prosperity and social welfare. I will then talk about some important practical challenges in implementing these goals. "
Let's examine how we are doing with those goals? Maximum employment — QEII and low interest rates have done nothing for this goal. Stable prices? We'll dig more into this, but this is absolutely false and prices are getting more out of whack. How about moderate long-term interest rates? I'm going to suggest that this is also missing the mark. QEII is about reducing interest rates so the US can meet its debt obligations and keep the illusion of US solvency intact. If and when there is a rationalization to normal interest rates there will be no such thing as moderating interest rates. Strike three in my opinion on the mandates and target goals of the Federal Reserve.
What's the purpose of all the QE? You must know that Chairman Bernanke and former Chairman Alan Greenspan believe that greater stock prices will lead consumers to buy more and borrow more as the "wealth effect" creates in their mind a sense of having more money. The notion that asset prices are increasing caused many in the early 2000's to lose all sense of rational expectations and believe that housing prices would always go up, that houses were the equivalent of ATM machines, that living off of one's credit cards is ok, and that all people deserve and are capable of being rich. While the mistakes and poor thinking in the 2000's were quite real, I am optimistic that Amerikans have learned some lessons and won't fall for the old asset price wealth effect trick again. Perhaps I'm naive, but I think many are now focused on living within their means and paying off debt, not incurring new and larger obligations.
September and October have provided almost all markets with out sized gains and have posted record results. Clearly the economic fundamentals must reinforce and justify the rocket launch right? Let's dig in and see where we are at.
RAILS – http://railfax.transmatch.com/ and http://www.aar.org/NewsAndEvents/~/media/aar/railtimeindicators/2010-11-rti.ashx
Total Rail Traffic continues to outpace 2009 levels for the current week. We are about 10% higher than those levels, yet are still down 4.2% from 2008 numbers.
RAILS / RECESSION INDICATORS
Waste and Scrap shipments are on par with last years levels. These shipments don't give us a clear indication of strength or weakness. Motor vehicle shipments are greater than 2009's dismal levels, but this should give us reason to pause and temper our elation.
Food Stamps – SNAP PROGRAM – http://www.fns.usda.gov/pd/34SNAPmonthly.htm
As I mentioned an earlier post this week, the Food Stamps Program continues to see greater and greater participation. The SNAP data continues to highlight how bad things have been on mainstreet. More families are drawing on the resources of the federal government and taxpayer for their food needs.

COMMERCIAL REAL ESTATE DATA – http://web.mit.edu/cre/research/credl/rca.html
Moody's MIT Transaction Report – Commercial Real Estate
The CPPI continues to decline and show an erosion of value in the national commercial property price index. The figures released for August show another 3.3% decline in values in actual transactions.
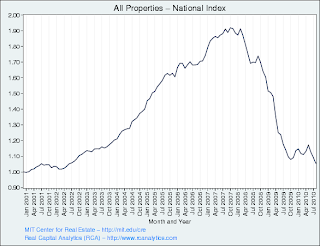
HOME PRICE INFORMATION / LEADING INDICATORS - ECRI – http://www.businesscycle.com/resources/
The ECRI data on home prices continues to show no improvement in this critical area of the economy. Real prices continue to reel and go lower through the August data release while leading indicators suggest that the pricing is simply flat.
MONSTER EMPLOYMENT INDEX REPORT – http://about-monster.com/employment-index
Jobs reports last week were surprisingly good and we see improvements in the weekly data. Unfortunately we are not seeing an improvement in the unemployment rate as more workers that just gave up are now coming back in search of job opportunities. Our unemployment rate is still at 9.6% and is quite sticky at that level.
Despite the good release, the Monster.com Employment Index dropped from a level of 138 to 136 in October. Why new job listings on the web would decline here is actually interesting. This is a really good report to watch and get some indication of where we are going.
On a separate note, Monster reported excellent earnings a couple of weeks ago. I should have been on this as an investment possibility as the huge surge in the index would and should have been a tip off to the potential rebound in earnings for the company. I'll continue to keep that in mind as I track this and highlight it as a potential trade in the future.

6 MONTH EURIBOR – Euribor rates continue to climb. Some of this increase is a result of the European nations holding firm and refusing to follow the stupid policies of our Federal Reserve. The lack of "relative" stimulus provided in Europe is marked by higher interest rates. Having said that, there are still real problems in Europe with countries like Ireland and Portugal, and don't forget our old friend Greece.
No matter what, it is unmistakable that there are "interesting" things going on in the last month as the 6 month Euribor rates have climbed about 15 bps or 10%. This is an inexact gauge but it is an item I watch every day in an attempt to measure stress in the banking system worldwide.

CDS SPREADS - http://www.markit.com/cds/cds-page.html
To continue on the thread that sovereign debt is still an issue, I wanted to include some data related to the CDS (Credit Default Swaps) pricing to offer protection against a default of one of these countries. You must recall that earlier this year CDS prices exploded as the European debt crisis was unfolding again. I am absolutely certain this will happen again just about the time when everyone forgets that these countries are really insolvent (like the US and every large bank). For those that aren't accustom to looking at these, note that the spread is 992 which means that a person would pay 992 basis points (bps) for protection against a default in a specific bond issued by the Venezuelan government. 992 bps is 9.92% a year! I personally never traded country specific CDS, but did do significant amounts of CDS in your investment grade corporate bond environment. Back in the early 2000's we would write protection on names like General Mills and Kraft for around 40bps (for very short time frames (1 year). While Venezuela is improving over the last week and month, Ireland, Spain, and Portugal CDS spreads are going nuts.
Increases of 25% are an indication of stress in the system! DO NOT GO TO SLEEP ON THIS! Remember April, when every thought we were going to keep going higher and then we hit this little debt crisis? Can you say "DO OVER?"
Venezuela
Spread 992
Daily Change 28.55
Weekly Change -91.92
28 Day Change -24.08
Ireland
Spread – 607
Daily Change 17.69
Weekly Change 109.17
28 Day Change 182.55
Spain
Spread 264
Daily Change 15.98
Weekly Change 39.83
28 Day Change 56.18
Portugal
Spread 464
Daily Change 14.89
Weekly Change 70.65
28 Day Change 78.57
WLI DATA – FROM ECRI - http://www.businesscycle.com/resources/ Last week's WLI Data shows continued improvement in the leading indicators. As I examine this data I find that since June 18th of this year the actual WLI data is showing a change of around 1% from that time. At the same time though, the S&P 500 is up more than 6% from those levels. It is clear that there might be improvement here in as shown by the WLI, but the market's rally may be ahead of itself.
COPPOCK TURN INDICATOR
The Coppock Turn Data continues to signal a turn south in the markets despite the exponential run in markets. The turn indicator has been wrong for two months now, but since it is a lagging indicator (14 month average) we must expect that and use this as just another slow warning. As usual I've tried to project levels in which it would actually signal a continuation of the positive trend, that level is at 12,300 on the Dow. I don't put much weight on this indicator, but include it as another data point.

FINANCIAL CONDITIONS INDEX– http://www.bloomberg.com/apps/quote?ticker=BFCIUS:IND
As you all know, I like the Financial Conditions Index provided by Bloomberg because it is a composite of many fixed income and monetary (liquidity) measures. The FCI is showing a value today of .15 which is once again over the critical 0 level. This is an indication that there is an expansion in the economy, but probably more accurately there is a huge expansion in the amount of liquidity in markets. We are nearing the 0.5 level we saw in April and this is going to either be a level of strong resistance coupled by the resurgence in a market correction, or it will give us an indication that the economy is truly recovering and going to be the basis for even greater levels in the stock and "asset" markets.
BALTIC DRY GOODS INDEX – http://www.bloomberg.com/apps/quote?ticker=BDIY:IND
With the ever-increasing prices for copper and other commodities, one would think that spot rates for transporting these goods around the world would also be increasing. In this case, that is actually not happening. As I've posted many times, the BDI is subject to many issues other than simply that commodity prices are going higher. First and foremost, I think the issue is that there is a ton of supply of ships available to move this cargo as shipping companies continued to order ships several years ago. I have seen a few comments about purchasing some of the dry bulk shippers like DRYS. Based on the chart I'm seeing, the thought of picking up a few shares might not be a bad one considering that there has been a recent breakout and it was confirmed with the move above $5.00 as I type. I also like that the increase has come on increasing volume. A very conservative trade could call for a stop to be placed at $4.75 and an upside target of $5.70.

DRYS CHART
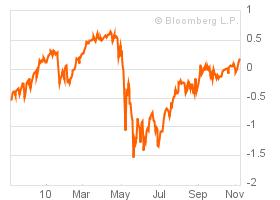
USD INDEX – http://www.bloomberg.com/apps/quote?ticker=DXY:IND
The USD index continues its assault on lower levels despite 2 days in a row now of being up. Since the May/June peak around $88, we've seen an almost uninterrupted dive to $76. Imagine that, a 13% drop in the value of the dollar and a move up in the overall markets of around 16%! Clearly the move higher in the markets is not due to improving economic fundamentals and a healthier environment. The unsustainable recovery in index asset levels is purely a move derived from US dollar debasement.
The FED's announcement last week of the use of $600 Billion of newly minted QEII to "stabilize" our economy has essentially created an environment where everything simply goes up. As the dollar goes down, asset prices in stocks, commodities, and everything else have simply risen to keep value somewhat constant. And if you didn't believe that Bernanke and the FED were serious, there is the overt threat that there is even more liquidity behind the $600 Billion in case it is needed.
While there is no proof that any of the QE will actually provide sustainable jobs or expansion in the economy, that doesn't mean that we won't have the facade of growth by way of ever increasing valuations of stocks. Of course when you value those stocks in terms of foreign currencies or in hard assets you find that we are getting nowhere.
The area we are in is pretty critical and the $76.00 level must hold or else we will see a real fall in the USD and a tremendous surge (even greater than we've seen) in gold and silver and other anti-US currencies. As stated previously, the gold and silver trades are now more than just commodities, they are trading as their own safe haven currencies and have taken on a life of their own. Yesterday the dollar was actually up and we saw silver go nuts. It is on days like these that I wish there was an easy and quick way to sell my physical silver as we've seen an almost 20% move in silver in two or three days. I've heard several stories as to what is going on with these moves from a massive short squeeze to the filing of inquiries and court actions against JPM for silver market manipulation. No matter what the cause, it is almost enough for me to want to exit. I simply haven't due to the trouble associated with packing it up and sending it out for sale. (Anyone want to buy some silver?)

NOVEMBER TRADING UPDATE
As much as the broader economy's recovery is still in doubt for me, there is little doubt that the FED is acting to not only buoy this market but to attach a rocket pack to its back and propel it to the loftiest levels. The policies that are being executed are making it impossible for one to remain in less risky assets like money markets and also makes one very cautious to hold on to other fixed income type holdings as the specter of run away pricing erosion becomes more real. What I mean here is that despite the notion that I still believe that we do not have inflation, there is rampant asset speculation in all the old standbys. Oil, copper, wheat and grains, sugar, coffee, cotton, and more all are going parabolic. I will say it again that this doesn't mean we have inflation, but it does mean that we have speculation like we did in June/July of 2008 where oil reached $147 a barrel. No one can suggest that that price in oil was caused by actual demand, but it was caused by loose monetary policies that brought our economy to its knees. It blows me away that we can have a FED that will sit idly by and allow it to happen again. What kind of recovery will we have if my $100 a barrel target for oil is hit?
Despite my protests, the FED has promised QEII and will promise more of QEIII as the second version fails. As a result our old trades are extremely profitable and are still ones that I highlight as winners. We need to remain in commodities or their representative ETFs like DBA, DBC, JJG, SLV, GLD, and more. We need to continue to trust in emerging markets for the reason that they are ACTUALLY growing at a pace well beyond the US's 2% AND are investments that are outside of the USD. Countries like Chile, Singapore, Malaysia, and Brazil have been my favorites. They have been winners for me for sometime and that trend has not been stopped. While there is every temptation to harvest gains, the real question needs to be….."And go where?"
As we have discussed, the potential canary in the coal mine here is the stress in the European countries as measured by Euribor and also by the sovereign debt CDS that I pictured above. If these continue to blow out this could derail the heroin induced rally the Fed has us on, just like what happened in April of this year. I don't want to get too excited about any drop in the market though because we have rallied so much in such a little time with NO pullback. We must expect some drop simply to digest the recent gains. WATCH THESE CDS AND WATCH THE EURIBOR RATES THEY WILL BE THE INDICATION THAT SANITY IS RETURNING TO THE MARKETS!
Given the tsunami of liquidity and threats of more liquidity we will continue to see more of the same for the next month as the FED continues to debase and devalue our currency in an attempt to make us all feel richer. Man, do I feel richer, don't you?