Slope of Hope Blog Posts

Slope initially began as a blog, so this is where most of the website’s content resides. Here we have tens of thousands of posts dating back over a decade. These are listed in reverse chronological order. Click on any category icon below to see posts tagged with that particular subject, or click on a word in the category cloud on the right side of the screen for more specific choices.

Who Killed the US Dollar? (by Springheel Jack)

By -

It was Ben Bernanke, from a helicopter, with a printing press!

Cluedo jokes aside though. I've been looking at the technical picture on USD and it really is starting to look very grim. The Fed is inflicting damage to USD, and IMO at least to the long term health of the US economy, on a scale that Osama Bin Laden could only dream of managing. Ben Bernanke could well succeed in doing to USD what the PIIGs have failed to do so far to the Euro.

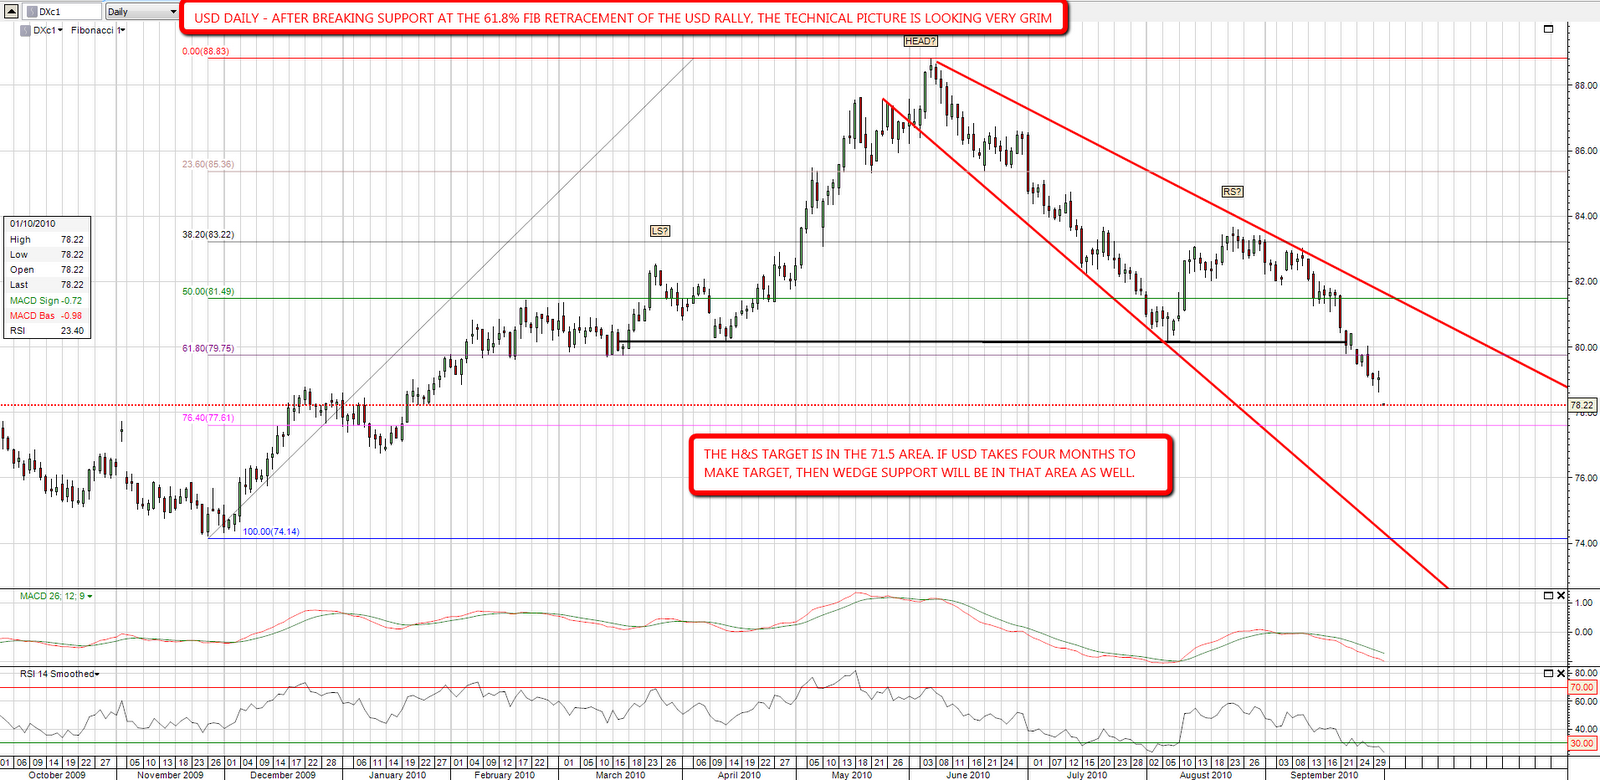
After breaking support at the 61.8% fib retracement of the USD rally, a new low is looking very possible. If we take three or four months to reach it, then the wedge target would be at the same level as the H&S target:

A similarly bleak picture in the inverse can be seen on EURUSD:

The picture looks marginally less optimistic on GBPUSD, where the big rising wedge that is forming looks potentially longer term bearish for cable at least. It is a monster pattern though, and GBPUSD could run up a lot further within it. I would point out though that rising wedges break up 31% of the time and that this rising wedge could also be an IHS with an upsloping neckline:

One thing I've been watching as the markets in the developed world have stalled in the last two weeks is how emerging markets and commodities have continued to run up. I've posted the rising wedges on GYX and EEM in recent days to show the big rising wedges on both. GYX continued up to hit the upper wedge trendline on Friday:

That looked encouraging for the bear side until I looked at the updated EEM chart, where the upper trendline has been hit and then gapped through. That could still be a wedge overthrow but this is not at all encouraging for seeing an interim top in the near future:

One of the few bright spots for bears at the moment has been the lagging financial sector, where XLF has been strongly underperforming SPX. I'm wondering though whether that is going to help the bears during what is beginning to look like a run on USD. That run on USD might help the bears only if the run triggers a general flight from all US denominated assets over the next few months, and it is possible that we are seeing the start of that at the moment:

I was reading earlier this week that on current trends the Fed is likely to overtake both Japan and China within two months to become the largest holder of US treasuries in the world. Every dollar of that holding has been purchased with a freshly printed dollar, so in effect the US has just been printing money to finance the ever increasing fiscal deficits. That is a policy that, when sustained, has only ever ended one way historically. Ben Bernanke is determined to avoid deflation, and he has the tools to avoid it for certain. You should always be careful what you wish for however, you might just get it. 🙂

Anyway, just some weekend thoughts. It's my birthday today and I'll be going to a wonderful restaurant / pub with the family for a great lazy afternoon. This being the UK, the weather stinks of course, but we'll be staying inside. Everyone have a great rest of the weekend. (Note from Tim: Happy Birthday, SHJ! We love ya!)

Bull Market In Money (by Springheel Jack)

By -

I'm not really seeing much on ES this morning. We've just been chopping around uncertainly so far this week and that could continue today. I have some some trendlines on ES that are showing more short-term potential downside than upside so I'm cautious on the long side right here. If ES can break 1150 then 1170 looks likely, but that's still an if so far, and we are stalled under the SPX January high for the moment. Here's the ES 15min chart:

100929_ES_15min_Trendlines

Looking around the world there are some big indices that don't look that bullish at the moment. On the FTSE we've actually been in a declining channel for the last couple of weeks. Currently the FTSE is in a small triangle and a break from that may give a direction for the next few days:

100929_FTSE_60min_Patterns

Unlike the FTSE, the EUR DAX futures chart hasn't even yet exceeded the August high. I'm seeing a rather larger triangle there:

100929_EUR_DAX_60min_Trendlines

One thing that is definitely making me wonder about the strength of this bull move in equities is the recent strength in 30yr treasuries. Looking back over the last year and a half there is no doubt at all that these tend to trend down when equities trend up. QE may moderate that effect to an extent and cushion the fall, but it has not made them rise at the same time.

It is strange then that long treasuries have been so strong in recent days, and I'm considering the possibility that these might be in a rising channel. I've put three possible resistance trendlines on the chart and the next peak should indicate which one is the right one.

100929_T30Yr_60min_Trendlines

As ever, the many silver and gold bears are being taken to the cleaners. I had thought that silver might find resistance at the 2008 high, but it was broken last week and if reached soon, I'm seeing channel resistance in the 23.75 area. If this move takes longer, and is as long as the last big wave up then it might go to 25.25 before the next interim top:

100929_Silver_Weekly_Rising_Channel_and_IHS

Looking at silver, we have a very healthy bull move going there. What is persistent strength in precious metals telling us? Only that precious metals look a better store of value than fiat currencies. Central bankers inflated a series of bubbles with low interest rates and easy money, and when that led to a crash, they have stepped in to fix the problem with even lower interest rates and a flood of money printing. Who says you can't teach an old dog new tricks?

Ben Bernanke has told us that he will print whatever quantity of money is needed to revive an economy already sick from repeated previous overdoses of easy money, and we all believe him. The bull market in precious metals may go a lot further yet.

Bullish Breaks (by Springheel Jack)

By -

Resistance broke at the ES IHS neckline overnight which was very bullish, though it remains to be seen whether we now run up quite a way further or fall back before the neckline is also broken during trading hours. There has been a lot of talk about SPX being overbought here. That's true on a short term basis but we're not yet overbought on the daily RSI of course:

100917_ES_Daily_IHS

There is still some chance that resistance might hold short term in the ESZ0 1132 – 1135 area today. I have a resistance trendline from 1075 on the 15min chart that has been tested four times previously and held. It has been tested hard in the last couple of hours but has held so far. If that ES resistance trendline breaks I'll be considering resistance levels in the 1145 to 1175 area:

100917_ES_15min_Resistance_Test

On 30 year treasuries the rising channel has now definitely broken down, which adds to the bullish picture on equities:

100917_30Yr_TREAS_-_Daily_Rising_Channel_Broken

EURUSD and GBPUSD made significant gains overnight but I won't repost the charts today as I've little to add to yesterday's comments. CADUSD broke resistance at 97.6 and the next obvious target is the rectangle top at 98.65:

100917_CADUSD_Daily_Rectangle

The Yen is looking interesting for a change here. I don't normally chart JPYUSD as it doesn't tend to hold trendlines well but a major resistance area is being tested and we could be seeing an IHS form:

100917_USDJPY_60min_Possible_IHS_Forming

Looking at the USD currency pairs I'm definitely thinking that the next obvious support for USD is at 80 as I posted yesterday, and if we are seeing a move there at the moment then ES / SPX could definitely run higher. I'll be watching resistance on my ES 15min chart but if it breaks, then I'm not seeing any obvious reversal level below 1150 SPX really.

What's worth noting at the moment though is that we don't yet have a break of the IHS neckline on the SPX daily chart. If we see a reversal below it before the market opens then there is still a significant chance of a short term reversal here. We are most definitely short term overbought. If we gap up above the neckline at the open though I'll be expecting to see a further run up in the next day or two.

There are a couple of external factors to note here. Firstly it is quadruple witching opex today, and the market often trades in a narrow range on such days. Statistically that does also leave us with a traditionally bearish week next week though all eyes will be on the Fed next Tuesday, when they will either announce the heavily trailed new QE push, which would be bullish for equities, or they won't announce one, which at this stage would disappoint a awful lot of people.