Slope of Hope Blog Posts
Slope initially began as a blog, so this is where most of the website’s content resides. Here we have tens of thousands of posts dating back over a decade. These are listed in reverse chronological order. Click on any category icon below to see posts tagged with that particular subject, or click on a word in the category cloud on the right side of the screen for more specific choices.
XLF Broadening Top (by Piker Trader)
Financial stocks have been rising over the last few days causing XLF to rise as well. The current price action has formed a Broadening Top Pattern.
The Broadening Top Pattern represents a rare reversal pattern and typically represents a top and being bearish. It is the opposite of the Symmetrical Triangle pattern that was previously formed in the market. It starts after a strong move upwards. The Pattern is then formed by a a stock or index making new high and a new swing lows, forming upward and downward sloping trendlines which represents the swing high and lows.
Fiddling While Rome Burns (by Springheel Jack)
I've mentioned before that I have a strong bear bias that I try to ignore as I chart shorter timeframes. Why do I have that bearish bias? A good illustration of the reason was shown in a great chart on Chart of the Day yesterday. Kyle Bass sent out a newsletter to investors and used this chart in that newsletter, while explaining that defaults on sovereign debt in much of the developed world are more or less unavoidable over the next few years, and that current policies of throwing good money after bad in order to delay the problem long enough that it might somehow disappear, are unlikely to be effective over periods of more than a few months. Here's the chart and if you click on it, the link will take you to the full writeup at Chart of the Day:
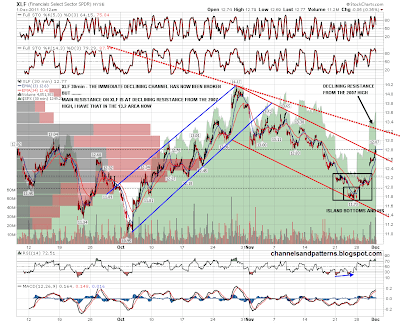
XLF Declining Resistance (by Springheel Jack)
I'll do a quick extra post today as I've been having a look at XLF this morning, and there is a very important resistance test coming up shortly if XLF rallies much further. That's best seen on the daily 6yr chart and you can see that XLF hit declining resistance from the 2007 high in April this year, and has been sliding down that trendline with multiple tests ever since:

Short term XLF has put in a solid low and broken the declining channel from the October high. Main declining resistance from 2007 is in the 13.2 2 to 13.3 area now. Will XLF break up through it? Who can say? If XLF does break over that declining resistance trendline though that will look very significant, and the resistance break might have serious implications for the wider market:
We shall see. Personally I wouldn't take the view that XLF breaking up would confirm a new cyclical bull market, but I would say that in the absence of XLF breaking up through that declining resistance, any sustained move up on equities here will look doomed to fail soon.
Hedging Two Banks Heavily Exposed To Europe
"Days to save the Eurozone", then the big rally
Hey fellow Slopers,
A couple of days before Wednesday's coordinated central bank action goosed global markets, Wolfgang Münchau wrote in his FT column ("The Eurozone has only days to avoid collapse") that if the European summit on December 9th didn't lead to an ambitious three part plan to save the Euro (an ECB backstop + a timetable for a Eurobond + plus an agreement on a fiscal union) the Eurozone risked collapse:
