The VIX spiked 18.45% Wednesday, raising hedging costs in many cases. In the table below, I've updated the costs (as of Wednesday's close) of hedging three major index-tracking ETFs against greater-than-20% declines over the several months, using the optimal puts, along with the costs of similarly hedging a handful of their most widely-traded components, and several other ETFs.
Two new ETF additions this week
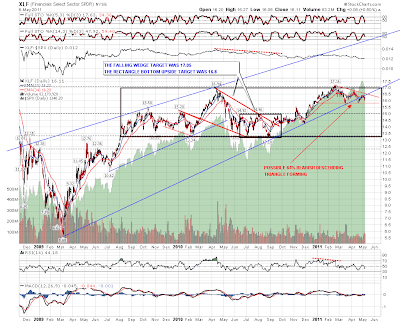
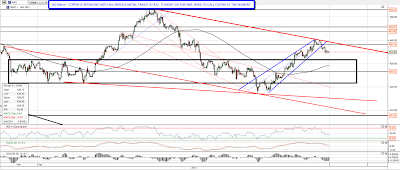
This week, I added the Financial Select Sector SPDR (XLF), and iShares MSCI Emerging Markets (EEM). First, a reminder about why I've used 20% as a decline threshold, and what "optimal puts" means in this context.
Decline thresholds
As I've mentioned before the threshold I usually use when I hedge is 20% (i.e., I want protection against any decline worse than that). The idea for a 20% threshold came from a comment fund manager (and Stanford finance Ph.D.) John Hussman made in October 2008:
An intolerable loss, in my view, is one that requires a heroic recovery simply to break even… a short-term loss of 20%, particularly after the market has become severely depressed, should not be at all intolerable to long-term investors because such losses are generally reversed in the first few months of an advance (or even a powerful bear market rally).
Optimal puts
Optimal puts are the ones that will give you the level of protection you want at the lowest possible cost. With Portfolio Armor (available as a web app, and an iOS app) you just enter the symbol of the stock or ETF you’re looking to hedge, the number of shares you own, and the maximum decline you’re willing to risk, (your threshold). Then the app uses an algorithm developed by a finance Ph.D. candidate to sort through and analyze all of the available puts for your position, scanning for the optimal ones.
A note about costs
To be conservative, Portfolio Armor calculates hedging costs using the ask price of the optimal puts. In many cases, you may be able to buy the puts for a lower cost (between the bid and the ask prices).
Costs (as of Wednesday's close) of hedging against >20% declines
|
Symbol |
Name |
Cost of Protection (as % of Position value) |
|
Widely-Traded Stocks |
||
|
INTC |
Intel |
3.37%*** |
|
CSCO |
Cisco Systems |
3.30%*** |
|
MSFT |
Microsoft |
3.07%*** |
|
LVLT |
Level 3 Communications, Inc. |
11.4%** |
|
BAC |
Bank of America |
5.25%*** |
|
F |
Ford |
3.30%** |
|
GE |
GE |
2.51%** |
|
PFE |
Pfizer |
2.42%** |
|
SIRI |
Sirius XM Radio |
No optimal puts: cost exceeds threshold |
|
S |
Sprint Nextel |
14.9%*** |
|
Major Index ETFs |
||
|
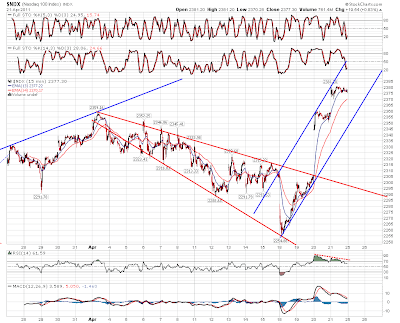
QQQ |
PowerShares QQQ Trust |
1.48%** |
|
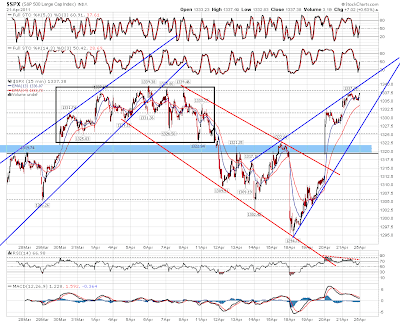
SPY |
SPDR S&P 500 |
1.29%** |
|
DIA |
SPDR Dow Jones Industrial Average |
1.13%** |
|
Precious Metals ETFs |
||
|
GLD |
SPDR Gold Trust |
0.49%** |
|
SLV |
iShares Silver Trust |
8.35%*** |
|
SGOL |
ETFS Physical Swiss Gold Shares |
2.49%** |
|
SIVR |
ETFS Physical Silver Shares |
7.27%** |
| Internet ETF | ||
| HHH | Merrill Lynch Internet HOLDRs | 2.56%* |
| Other Sector ETFs | ||
| XLF | Financial Select Sector SPDR | 2.53%** |
| EEM | iShares MSCI Emerging Markets | 2.86%** |
*Based on optimal puts expiring in November, 2011
**Based on optimal puts expiring in December, 2011
***Based on optimal puts expiring in January, 2012
Thank you
The Portfolio Armor iOS app cracked into the top-20 finance iOS apps this week:
Thanks to those of you woul downloaded it.