Slope of Hope Blog Posts
Slope initially began as a blog, so this is where most of the website’s content resides. Here we have tens of thousands of posts dating back over a decade. These are listed in reverse chronological order. Click on any category icon below to see posts tagged with that particular subject, or click on a word in the category cloud on the right side of the screen for more specific choices.
AAPL Follow up+Futures (By eMiniSchool)
This is a follow up video from the AAPL timing high video. If AAPL closes below last weeks low we would have a bearish engulf at price and time resistance.
The market had a wild day breaking the symmetry but it is important to know that the symmetry was what we consider to be minor meaning; since the March 09 low the pullbacks have been very shallow and today we broke out of that shallow type corrective condition.
This is the first ABC from the high so it is still labeled bullish even though it feels bearish. Yes, the pattern as it goes could turn to a bearish pattern but that is still a few legs away. We say that it is the last bullish pattern that fails is what starts a new direction so we need to find a low bounce and then fail before we can say the high is in for sure.
We are coming up to the next support so we would be aware of a big reversal day coming soon if not tomorrow.
Happy Trading,
Original AAPL Video: http://eminischool.blogspot.com/2011/07/aapl-timing-video.html
July 20th 78% time resistance video: http://eminischool.blogspot.com/2011/07/fib-time-video.html
JPM & TBT Poised for Upside Reversal (Paulenoff)
If the directional overlay of the big money center banks — i.e., JP Morgan (JPM) — on the ProShares UltraShort 20+ Year Treasury (TBT) is any gauge, then the mature downtrend in both JPM and the TBT is poised for a powerful upside reversal.
The TBT hit its low on July 12 at 31.87 and has climbed to 33.25, while JPM hit a new multi-month low today at 38.93, but has recovered to 39.50 so far.
This chart is "warning" us that higher rates matter to a major lender like JPM, especially in a likely new regulatory environment that seeks to redefine banks in a more traditional business role (not as speculative hedge funds). The key to such a successful transition for a JPM, for instance, is an ability to make money by borrowing near term, and lending longer term. Higher longer term rates will accomplish that, which just might be what this comparison chart is telling us.
Of course, it also could be telling us that no matter what Congress and the President decide to do about the debt ceiling and the deficit, credibility and trust in the efficacy of the U.S. Government has taken a serious hit in confidence, which is why longer term rates (and the TBT's) are headed higher.
Nonetheless, regardless of the reason for higher longer-term rates, JPM should benefit.
Originally published on MPTrader.com.
Are Women Better Investors?
Are women better investors than men? That's what David Weidner argued in his widely-tweeted MarketWatch column Tuesday, "Women are better investors, and here's why".
From Sex Scandals to Investing
After reminding readers of recent sexual scandals involving male politicians, Weidner actually made a broader argument, that women are better at pretty much everything:
Why is it that men so often self-destruct? In the political world, Weiner joins Eliot Spitzer, Bill Clinton, John Ensign, Arnold Schwarzenegger and John Edwards as hypocritic slimeballs who let their pants set their personal policy.
[…]
Women, on the other hand, do almost everything better. We’ve known this intuitively for a long time. If you didn’t, just ask your wife or your mother. But now there’s a raft of evidence that suggests women are better at everything — including investing.
Women take fewer risks
Weidner went on to cite studies by Barclays Capital, PLC (BCS) and Ledbury Research, and Merrilly Lynch, respectively, that found that women were more likely to make money in the market, because they take fewer risks, as well as Dan Abrams's new book, “Man Down: Proof Beyond a Reasonable Doubt That Women Are Better Cops, Drivers, Gamblers, Spies, World Leaders, Beer Tasters, Hedge Fund Managers, and Just About Everything Else.” This sort of cheerleading about the superiority of women, particularly in the context of financial decision making, isn't new.
Not a new argument
In his New York Times column two years ago ("Mistresses of the Universe"), Nicholas Kristoff made a similar argument:
At the recent World Economic Forum in Davos, Switzerland, some of the most interesting discussions revolved around whether we would be in the same mess today if Lehman Brothers had been Lehman Sisters. The consensus (and this is among the dead white men who parade annually at Davos) is that the optimal bank would have been Lehman Brothers and Sisters.Wall Street is one of the most male-dominated bastions in the business world; senior staff meetings resemble a urologist’s waiting room. Aside from issues of fairness, there’s evidence that the result is second-rate decision-making.
Blaming men
Kristoff seemed to be unaware that the former Chief Financial Officer of Lehman Brothers (LEHMQ.PK) wasn't a "dead white man" at all, but the live woman pictured below, Erin Callan. This photo, which appeared in a Wall Street Journal article from May, 2008 ("Lehman's Straight Shooter: Finance Chief Callan Brings Cool Jolt of Confidence To Credit-Rattled Street") was captioned as follows: "Erin Callan is known for being frank, fashionable".

Kristoff continued,
“There seems to be a strong consensus that diverse groups perform better at problem solving” than homogeneous groups, Lu Hong and Scott E. Page wrote in The Journal of Economic Theory, summarizing the research in the field."
Gender diversity and risk management
Perhaps Mr. Kristoff would have been a little more skeptical were he aware that gender diversity at high levels of financial firms didn't seem to help the problem-solving processes at those firms. In addition to Callan, other women held high roles at major financial firms that stumbled during the financial crisis, including Sallie L. Krawcheck, former CFO at Citigroup, Inc. (C); Zoe Cruz, former head of trading and risk operations at Morgan Stanley (MS); and Amy Woods Brinkley, chief risk executive at the time at Bank of America Corporation (BAC).
Are women really better investors?
How to reconcile the studies cited by David Weidner, which showed that among individual investors, women tend to have higher returns, with the paucity of women on "greatest investors" lists (e.g., this one from Investopedia, which lists 19 men and 0 women)? Perhaps investing is a field where women are better on average, but men are better represented at the far ends of the bell curve. One thing seems clear though: women aren't better at everything than men. Men are clearly better at pandering.
Hedging costs of stocks discussed above
The table below shows the costs, as of Tuesday's close, of hedging four of the stocks discussed above against greater-than-20% declines over the next several months, using the optimal puts for that. First, a reminder about what optimal puts mean in this context, and why I've used 20% as a decline threshold.
Optimal Puts
Optimal puts are the ones that will give you the level of protection you want at the lowest possible cost. As University of Maine finance professor Dr. Robert Strong, CFA has noted, picking the most economical puts can be a complicated task. With Portfolio Armor (available on the web, and as an Apple iOS app), you just enter the symbol of the stock or ETF you're looking to hedge, the number of shares you own, and the maximum decline you're willing to risk (your threshold). Then the app uses an algorithm developed by a finance Ph.D. to sort through and analyze all of the available puts for your position, scanning for the optimal ones.
Decline Thresholds
You can enter any percentage you like for a threshold when using Portfolio Armor (the higher the percentage though, the greater the chance you will find optimal puts for your position). The idea for a 20% threshold comes, as I've mentioned before, from a comment fund manager John Hussman made in a market commentary in October 2008:
An intolerable loss, in my view, is one that requires a heroic recovery simply to break even … a short-term loss of 20%, particularly after the market has become severely depressed, should not be at all intolerable to long-term investors because such losses are generally reversed in the first few months of an advance (or even a powerful bear market rally).
Essentially, 20% is a large enough threshold that it reduces the cost of hedging but not so large that it precludes a recovery. When hedging, cost is always a concern, which is where optimal puts come in.
Hedging costs as of Tuesday's close
The data in the table below is as of Wednesday's close. I've added SPDR S&P 500 (SPY) for comparison purposes.
| Symbol | Name | Cost of Protection (as % of position value) |
| (BAC) | Bank of America Corporation | 6.94%** |
| (MS) | Morgan Stanley | 4.91%** |
| (C) | Citigroup, Inc. | 3.33%* |
| (BCS) | Barclays, PLC | 5.19%* |
| (SPY) | SPDR S&P 500 | 1.28%* |
*Based on optimal puts expiring in December, 2011
**Based on optimal puts expiring in January, 2012
Codeine-Tinted Charts (by Springheel Jack)
Well I'm out of hospital and getting used to getting round on crutches (Editor's Note – we have here further proof that Slopers are tough traders!). Getting fully back to my usual routine is still hampered by having to spend much of the day with my broken leg up for the next week or so, and by the significant amounts of opiates I am taking which are making me a bit groggy. Nonetheless I've been having a good look at some charts this morning and if everyone will cut me some slack for my codeine-tinted vision then I have some interesting charts to show today. Many thanks for all the supportive messages from everybody this week :-).
I've been caught somewhat by surprise by this latest reversal this week, which I wasn't expecting after the ES break up through declining resistance before Tuesday's open. The reversal is significant, but hasn't yet done any major technical damage, and to see why I'll post the updated and unamended versions of the RUT and NDX daily charts that I posted on Thursday last week so you can see what I mean. Here it is on NDX:

Here it is on RUT and you can see that NDX and RUT have both touched again, and so far bounced precisely at, the channel support trendlines I posted last week. That's not to see that equities won't decline further, but it underlines that significant support is still holding so far, and that we reached a possible bounce level yesterday:

One thing we're not seeing on this move down is any support from a falling EURUSD so far. EURUSD has been in a tight uptrend channel since the recent low and the equities waterfall this week hasn't halted that rise so far:

Copper is still holding an uptrend as well, though the rising wedge forming looks bearish and we may see a quick move to 395, and possibly 385, if short term support breaks:

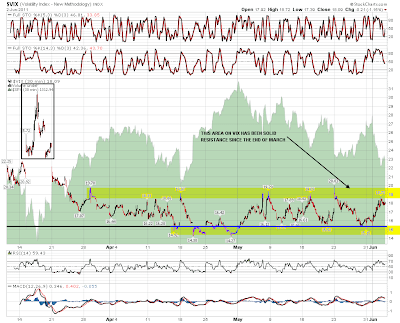
As I'm writing ES is testing 1295 and those trendlines on NDX and RUT look likely to break at the open. A strong move down today could move us out of the current trading range on Vix that's been holding since March:
I posted the four year chart of the SPX daily bollinger bands last week to show that there was almost always a strong rally after a break down through the daily bollinger bands on SPX. We saw that strong rally afterwards last week and if the pre-market fall on SPX is sustained, SPX will break down through the daily BBs again today. Thanks again to Pug for posting the original of this excellent chart:

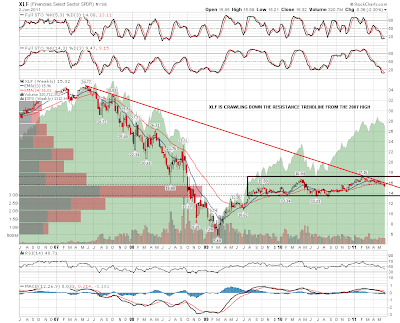
As an aside the longer term XLF chart is looking very interesting this morning, with XLF still crawling down declining resistance from the 2007 high. There's definitely scope for XLF to move back down below 14 within the two year trading range since August 2009:
I'm seeing some immediate support for ES at the 1295 level today, and there's a possible H&S neckline in the 1290 area slightly below. If we do break down out of the SPX daily bollinger bands today then I'll be looking for a short term low to be established on SPX today or Monday that should deliver at least a decent bounce. I'll be having a broader look over the weekend to see whether I can get a better idea of where this is headed, though a retest of the March lows in the next few weeks as Pug and others are expecting seems very possible from here.
