Slope of Hope Blog Posts

Slope initially began as a blog, so this is where most of the website’s content resides. Here we have tens of thousands of posts dating back over a decade. These are listed in reverse chronological order. Click on any category icon below to see posts tagged with that particular subject, or click on a word in the category cloud on the right side of the screen for more specific choices.

Opex Week (by Springheel Jack)

By -

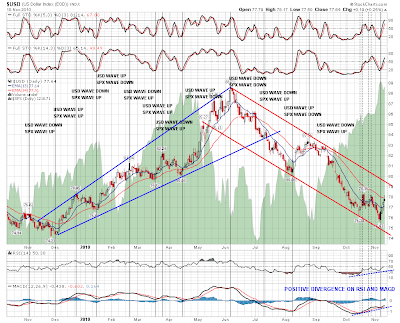
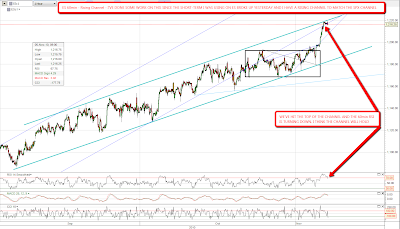
I'm not leaning towards a very deep retracement right here. My feeling is that we will rise this week, make a new high on SPX, and then start a deeper correction that will take us back towards 1150. I might well be mistaken however.

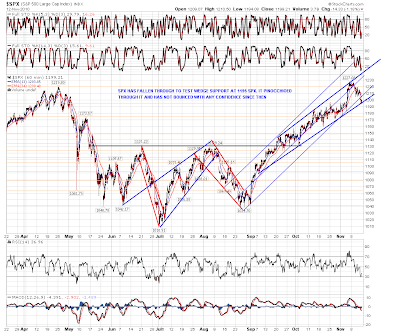
We are seeing real weakness on SPX after last week, and at the least the topping process looks well advanced. On SPX the rising channel from the August low was broken with conviction on Friday and wedge support from 1085 was tested:

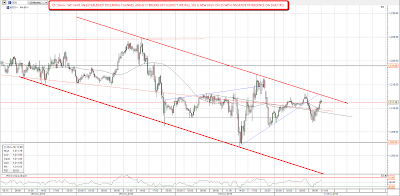
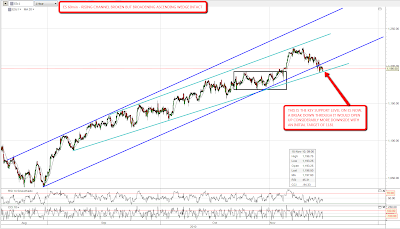
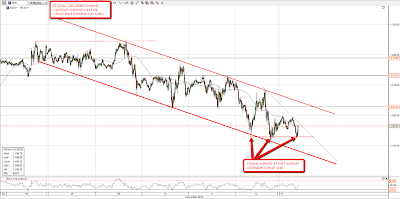
The picture on ES looks even clearer, with that wedge support trendline tested on Friday and retested overnight. It has held so far:

Short term, ES is still in a declining channel from the high which is offering some very nice short and long entries and exits while it lasts. There are a couple of things to add to that here though. Firstly there is strong support at the Thursday overnight low at 1193. That has been tested twice since on Friday and overnight but the level has held on an hourly basis, and is the key initial support level if ES is to decline further. It is made even stronger by the fact that to break it with confidence the lower wedge trendline from 1085 would also have to be broken. With that caveat in mind, declining channel support is currently at 1188, and resistance is at 1204.5. Both levels are steadily declining of course as long as the channel holds:

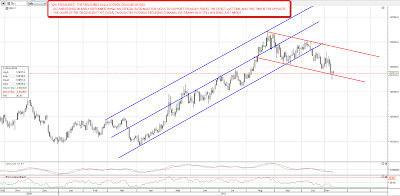
On the bigger picture we are still obviously some distance above EURUSD wedge support in the 1.32 area, and other USD currency pairs look ready to fall further as well. AUDUSD has an obvious target in the 95 area, which would also be close to a retest of the broken broadening formation at 94:

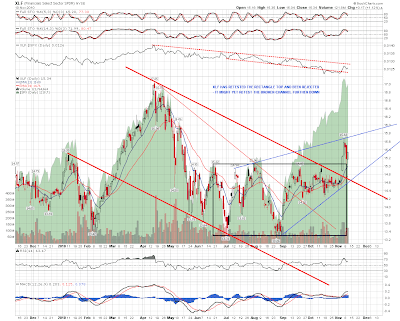
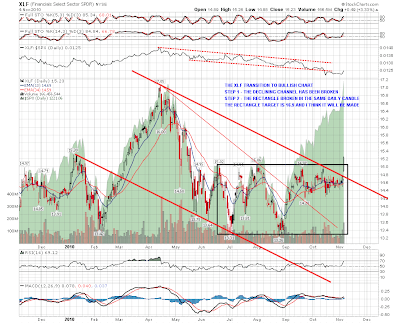
I posted the XLF chart last week showing that it had bounced twice at the top of the broken rectangle. I wondered aloud then whether that support might break and open up a retest of the broken declining channel upper trendline just under 14.7, and we saw that support break on Friday. More downside looks likely but if it makes that retest XLF will look very interesting as a speculative long:


It is options expiry week this week of course and that is not generally a week for steep declines. I'll be watching for a break up from the ES declining channel, which would be a good short term long entry if we see that today.


Leisa here:  I was unable to get a sector report post out.  I'm going to piggyback on SHJ's post and give you the download link if you are interested.  Here's the graphic  and the report here.

The US Dollar Bounce (by Springheel Jack)

By -

So much market forecasting nowadays comes down to the direction of the US dollar, and that's the main issue this week too as I see it. USD has bounced, eventually, off triangle support on the weekly chart and more importantly off declining channel support on the daily chart. The obvious target is the top of the channel and the question today is the likely path it will take to get there. Here's the declining channel on the daily chart and, for the benefit of anyone who is still skeptical about the effect of USD on equity prices, I have used my daily chart with SPX as the background, and with the wave relationships between USD and SPX marked on the chart:

EURUSD is 55% of the USD index of course, and so acts as a good inverse proxy for USD for charting purposes. I chart this directly from the forex markets as those markets are very deep and liquid, and not therefore prone to the strange short-lived spikes up and down that appear on the USD futures chart from time to time. On the EURUSD daily chart the rise from the June low  is in the form of a broadening ascending wedge, which is normal for EURUSD, which generally trends in a wedge of one type or another. Wedge support is in the 1.32 area and EURUSD has fallen back to the strong support level at 1.37. The question is what happens here?

There are two paths for EURUSD to take from here in my view. The first path is to complete the H&S pattern that appears to be building, by bouncing back over 1.40 over the next few days to make the right shoulder for the pattern, and then to fall to wedge support. The second is for EURUSD to break support at 1.37 on a daily close basis and then head straight towards wedge support:

For that reason I also have two scenarios for ES / SPX over the next few days, and they are directly linked to those two EURUSD scenarios. If EURUSD doesn't break support and makes the right shoulder on that H&S, then I'd expect ES to make a new high, with negative divergence on RSI, and we'd see an interim top made there that should last two to four weeks in all probability while ES / SPX and EURUSD both correct. If EURUSD breaks support at 1.37 then we should see both go significantly lower over the next few days. If we're taking the second path, then there's a declining channel on ES that I'd expect to see hold, and here it is on the 15min chart. Resistance is just under 1213, and I'm short until that breaks up. If we make it to the lower trendline of the declining channel today, then that should be hit in the 1194 – 1195 area:

I've been watching XLF with interest since the break up a few days ago. It has returned to retest the broken rectangle in recent days and that has held so far. The next obvious target is the rectangle target in the 16.8 area, but I'd be reluctant to play that unless ES breaks up from the declining channel. If ES continues to correct from here, then I'd be wondering about a possible retest of the broken declining channel and that would look like a very attractive long entry if XLF reached there:

I mentioned at the beginning of September that one stated purpose of QE2, to support treasury prices, was a polite fiction, and that the real intention and effect would be to support equity prices while treasuries would trend sideways to down at best. Looking at the chart for 30 year treasuries today, I'm not seeing anything to change that opinion, although I might eliminate the word sideways from my forecast. Expect more downside, though treasuries could well bounce here as they are at the lower trendline of a possible declining channel:

Major Breaks Up (by Springheel Jack)

By -

I love channels. They give structure to a trend. They deliver good entry and exit levels. They're dependable, though to be used with caution like any other technical analysis tool. The current SPX rising channel is of long enough duration, and steep enough, that it should contain the current wave up until we get confirmation that the wave has finished through the channel breaking down. I was therefore not at all happy to see that SPX closed slightly above the SPX rising channel yesterday:

If SPX had closed at the top of the channel rather than slightly above it I would very confidently be calling for a retracement today. As it is I think a retracement is still likely, but the odds of a further upside breakout have increased considerably. The rectangle target at 1220 SPX was made yesterday, so that at least is no longer in play.

My short term ES channel broke up yesterday and I've had a hard look at ES to determine the current structure there. We have an almost identical channel to the SPX channel on ES, and that channel has not broken up, with an exact touch at yesterday's high:

My slightly more cautious call for a retracement today therefore gives the following levels on ES:

  • 1220 – 1222 – Strong resistance at upper channel trendline
  • 1202 – 1204 – Retracement target at mid-channel line (and recently short-term channel upper trendline)
  • 1183 – 1185 – Strong support at the lower channel trendline

Longer term what was left of the technical bear case received another severe battering yesterday and to my eye there isn't much left. The SPX 200 SMA on the weekly chart was broken convincingly, which was powerful bull market confirmation, and one of the last hopes of the bears, that financials would drag the market down, was also largely demolished in a single dramatic daily candlestick yesterday. XLF managed to break both the declining channel from April and the rectangle in a single day yesterday, and the rectangle target is now 16.9, which looks undemanding given that is still below the April high:

USD has now finally broken triangle support, though there has not yet been a break on a weekly basis. We'll see if we get that today. I have a decent quality declining trendline on the daily chart that I posted yesterday but looking at the weekly chart, my next declining support trendline would be hit in the 60 area, which is (cough) something to think about:

The bears are complaining that this bull market is an artificial construct based on a huge and unsustainable wave of government borrowing. I agree completely, but I think that's missing the point. All bull markets in recent years have been wild moves up based on fantasy and fraud, and this current bull market is built on even finer sand than the last two. My long term view is that we're in a steep reversion to the mean declining channel from the first bubble in 1995 – 2000, and that this current bull market is simply a return to the top of that declining channel. Here's the long term chart of the SPX adjusted for CPI and you'll see what I mean:

Looking at that real terms SPX chart I'm getting an upside target for the current bull market in the 1450 area, and I think we're going to make it to that target. We won't make it there in a straight line, and after we reach it I'm expecting the current bull market to end with a bond crisis to end the current wave of government borrowing, and an equities bear market that will be consequently uninterrupted by keynesian interventions. Until that time we should just buckle up and enjoy the ride.

I did a post in August going through this scenario in some detail. The short term gartley pattern leg down I was looking at then didn't play out, but the rest of my projection for this bull market is still valid and you can see that here.

Four Financial Charts to Watch (Mike Paulenoff)

By -

In our Webinar Monday evening, we reviewed the financial sector, a video clip of which is available here and whose chart analysis is still very applicable today, ahead of the Fed announcement.

Starting with Bank of America (BAC), which has had a major correction already, my sense is that before it makes another downleg a rally is coming first. So if you think you want to be short BAC or long some inverted ETF, my sense is there'll be a higher price to do that. I think a rally can get close to 12.00. The larger picture is still in a massive downtrend, although if it's somehow able to chew through 13.00 and 14.00, then it will have broken out of that downtrend.

JP Morgan (JPM)'s chart doesn't do it for me on the long side. I understand that as long as it holds around 36, it's in okay condition, but the fact that it had a chance to break out and challenge resistance around 41-42 and failed suggests to me that this consolidation is going to fail. Maybe if BAC rallies to 12, JPM can attack the trendline again from the April high at around 39.30. But if it gets there, then I think it'll come back down and struggle to maintain support at around 35.62 to 35.16. If it breaks there it'll really have a problem.

Wells Fargo (WFC) looks a lot better than BAC and JPM, and has what can be considered a double low in the 23 1/4 to 22.90 area. But to get any traction it needs to take out resistance. If it closes above or accelerates through 26.50, then I think something positive is going on.

Citigroup (C) was my favorite and still has a pattern that looks good to me. From a weekly perspective, it has a series of lower highs and higher lows. If it can hurdle the 4.30-.32 area where it peaked last time, the next level would be the trendline at around 4.70. If it can somehow take out the trendline it would be very positive, with a target of close to 6.


Originally published on MPTrader.com.