Slope of Hope Blog Posts

Slope initially began as a blog, so this is where most of the website’s content resides. Here we have tens of thousands of posts dating back over a decade. These are listed in reverse chronological order. Click on any category icon below to see posts tagged with that particular subject, or click on a word in the category cloud on the right side of the screen for more specific choices.

Waiting for a Break (by Springheel Jack)

By -

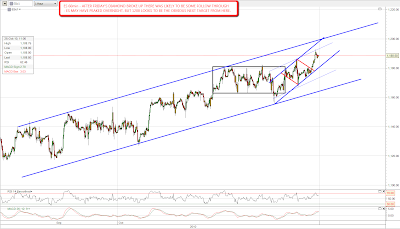
There are two immediate scenarios for SPX and ES that I can see. We are either in a rising channel, or a rectangle, or both. You can see that on this chart:

The best patterns on SPX are those that are repeated on ES, and the rectangle is the better current pattern on that basis, but we also have a rising channel on ES, albeit with a lower upside target. In terms of SPX, the rectangle target is 1220 and the rising channel upper trendline is in the same area. On a break of the recent highs with confidence, that is where I would expect to find resistance next. Technically the next rectangle target is at the lower trendline, but to reach it the rising channel would have to break, so I'm doubtful that we'll see that. Another touch of the upper rectangle boundary without an interim touch of the lower boundary will indicate a high probability that the rectangle is about to break up, and rectangles like this break up about 70% of the time in any case.

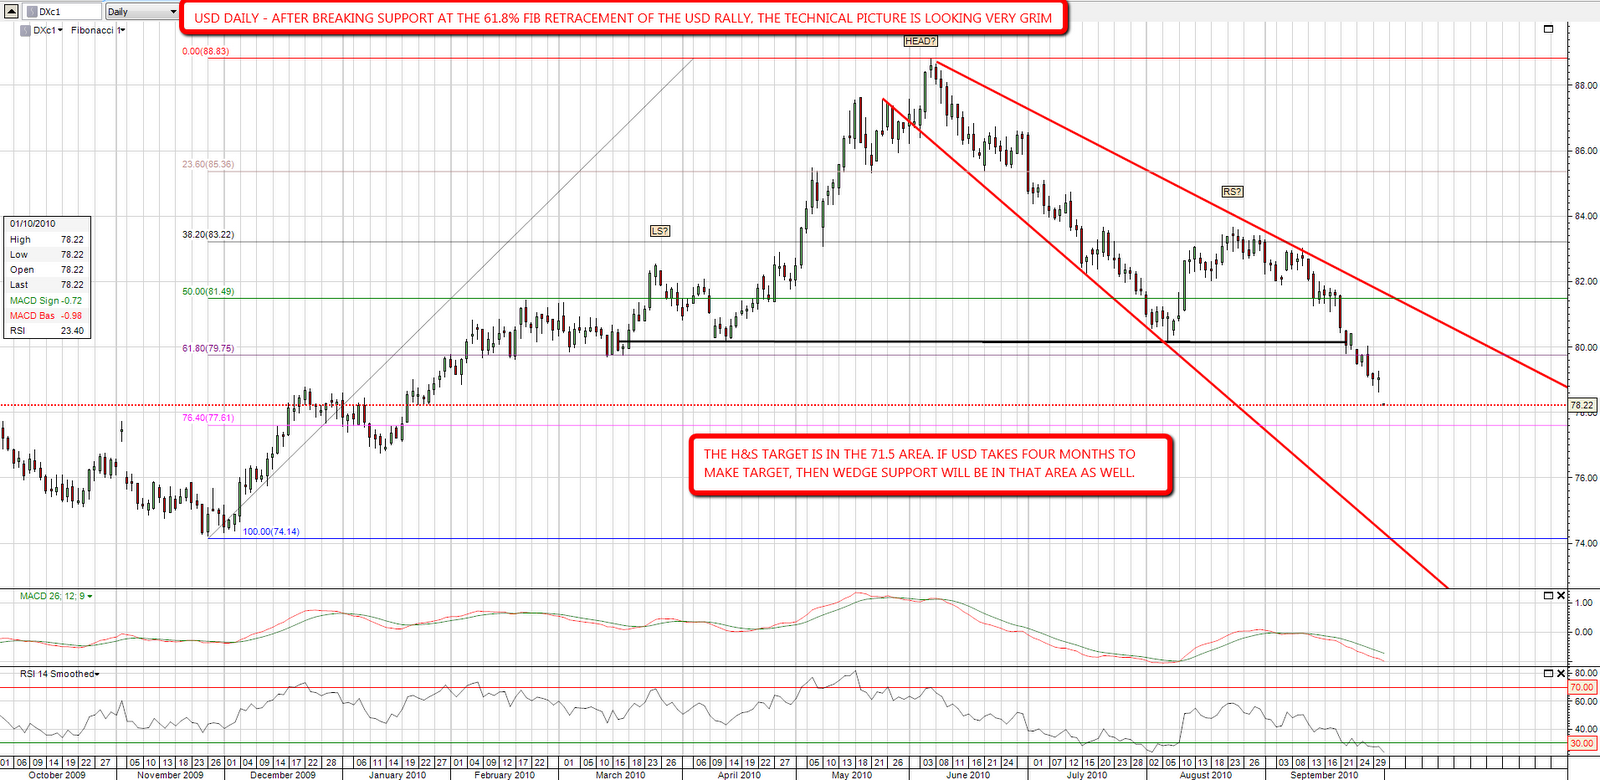
I've been looking again at USD and the picture still looks bullish until the lower triangle trendline is broken. It isn't encouraging that USD has really no more than stalled at that trendline since it was reached, and dollar bulls are very hard to find nowadays, but the risk/reward favors the long side here regardless until triangle support is broken. If that happens then USD could fall a lot further and, though could find some support at the 70.70 low, my next trendline target would be in the mid-60s:

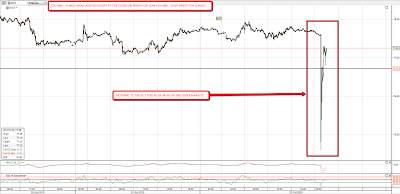
EURUSD is 55% of the USD index so it is the critical element for any USD bounce. The declining channel on EURUSD is still intact though the upper trendline has been tested twice in the last two days and it failed to make the lower channel trendline on the last wave down. If the channel breaks up then the prospects for USD will look much more doubtful and the prospects for equities much more bullish. It isn't a coincidence in my view that since EURUSD topped three weeks ago, equities have stalled:

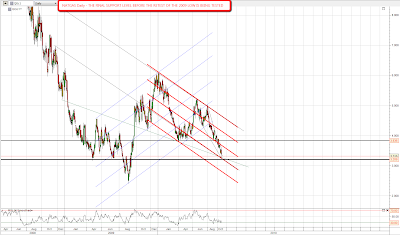
One chart that still looks very bearish amidst the bullishness of the last two months is XLF, with financials still within a clear declining channel from the April high. From the chart is looks poised to move down further though if XLF were to break up through the declining channel upper trendline, and then the upper rectangle boundary, the picture would then look very bullish. Financials are in serious trouble over the ongoing mortgages fiasco though, and it is a little hard to see that happening at the moment:

Bulls Break Up (by Springheel Jack)

By -

I posted two channels on Friday, one rising and one falling, and at the intersection they formed a diamond. That diamond broke up late on Friday and ES moved to a new high overnight. It may have peaked, but looking at the chart the obvious next target is 1200:

USD moved down as well, but as yet there's nothing yet to suggest that the recent low in USD was not a major low. If EURUSD makes a new high though then the next target up is 1.43, and USD will then make a new low. Any move on EURUSD over 1.41 will make that look very possible:

There was some odd stuff appearing near the close on Friday and over the weekend. For a while on Saturday /TF (Russell 2000 futures) appeared to be trading on TOS and OptionsXpress and 5% down. Even stranger was the apparent move in /DX (USD futures) on Friday night, where there was a massive spike down that was recovered within 30 minutes. In terms of scale this move would have been approximately equivalent to a move on EURUSD from 1.395 to 1.46 and back again. I'm assuming that this was a ghost in the machine and that any trades from this 'USD flash crash' will be cancelled this morning. Here it is on the DX 5min chart:

Looking at other charts I saw on Friday that the big falling wedge on XLF had evolved into a big declining channel. Financials have shown few signs of life on this big move up on equities, and there's no sign yet that they're going to start recovering anytime soon:

There's been a lot of talk that natural gas might bounce soon, but there's not much sign of that on the daily chart. It could bounce, we're not at the last major support level above the 2009 low. If it breaks then a retest of the 2009 low looks very likely:

Friday was an unusual day for two reasons. Firstly the range was the smallest of the preceding seven days, so the GapGuy says that any opening gap is less likely to be closed. The second reason was that Friday was an all up day, in which SPX,USD, Oil, Gold and AGG (bonds ETF) were all up. Historically these are usually followed by negative closes but I'd be cautious about putting any money on that today unless we first see a hit of the obvious ES resistance level at 1200.

Some people have been having trouble viewing much chart, so I'm trying something different this morning and linking the smaller charts to screencast. Clicking on a chart yields a much bigger chart.

Who Killed the US Dollar? (by Springheel Jack)

By -

It was Ben Bernanke, from a helicopter, with a printing press!

Cluedo jokes aside though. I've been looking at the technical picture on USD and it really is starting to look very grim. The Fed is inflicting damage to USD, and IMO at least to the long term health of the US economy, on a scale that Osama Bin Laden could only dream of managing. Ben Bernanke could well succeed in doing to USD what the PIIGs have failed to do so far to the Euro.

After breaking support at the 61.8% fib retracement of the USD rally, a new low is looking very possible. If we take three or four months to reach it, then the wedge target would be at the same level as the H&S target:

A similarly bleak picture in the inverse can be seen on EURUSD:

The picture looks marginally less optimistic on GBPUSD, where the big rising wedge that is forming looks potentially longer term bearish for cable at least. It is a monster pattern though, and GBPUSD could run up a lot further within it. I would point out though that rising wedges break up 31% of the time and that this rising wedge could also be an IHS with an upsloping neckline:

One thing I've been watching as the markets in the developed world have stalled in the last two weeks is how emerging markets and commodities have continued to run up. I've posted the rising wedges on GYX and EEM in recent days to show the big rising wedges on both. GYX continued up to hit the upper wedge trendline on Friday:

That looked encouraging for the bear side until I looked at the updated EEM chart, where the upper trendline has been hit and then gapped through. That could still be a wedge overthrow but this is not at all encouraging for seeing an interim top in the near future:

One of the few bright spots for bears at the moment has been the lagging financial sector, where XLF has been strongly underperforming SPX. I'm wondering though whether that is going to help the bears during what is beginning to look like a run on USD. That run on USD might help the bears only if the run triggers a general flight from all US denominated assets over the next few months, and it is possible that we are seeing the start of that at the moment:

I was reading earlier this week that on current trends the Fed is likely to overtake both Japan and China within two months to become the largest holder of US treasuries in the world. Every dollar of that holding has been purchased with a freshly printed dollar, so in effect the US has just been printing money to finance the ever increasing fiscal deficits. That is a policy that, when sustained, has only ever ended one way historically. Ben Bernanke is determined to avoid deflation, and he has the tools to avoid it for certain. You should always be careful what you wish for however, you might just get it. 🙂

Anyway, just some weekend thoughts. It's my birthday today and I'll be going to a wonderful restaurant / pub with the family for a great lazy afternoon. This being the UK, the weather stinks of course, but we'll be staying inside. Everyone have a great rest of the weekend. (Note from Tim: Happy Birthday, SHJ! We love ya!)

Chart on Citigroup (by Mike Paulenoff)

By -

The chart pattern in Citigroup (C) has the look a price structure that's on the verge of thrusting to the upside to enter a secondary powerful upleg off of the low at 3.63. The optimal swing target is 4.20/22, and an outside target zone is 4.38-4.44 thereafter. Only a decline that breaks 3.89 will compromise the current bullish set-up.

6mLaNILdM
Originally published on MPTrader.com.