The stock market’s trends are up, but a contrarian pivot point is likely on the horizon
Excerpted from the January 19 edition of Notes From the Rabbit Hole, NFTRH 845
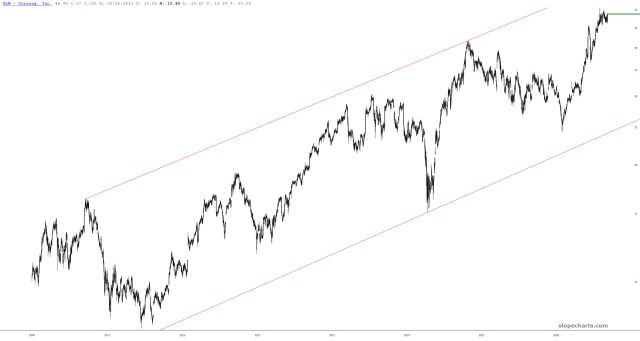
As an intro to this fundamentally bearish article, I would like to state that strictly as a technical analyst, I have a bullish view of the US stock market. There can be no other view for a TA, given the firm uptrends. But from the macro-fundamental side of things, danger signals aplenty manifested in 2024, into the new year.
(more…)