In recent weeks, I have become increasingly disenchanted with common stocks as a vehicle for shorting. That is not to say I’m not shorting them – far from it – but I have decided to strike out for more temperate, less shark-infested waters, and have been keeping my eyes open for good charts in other financial realms. (more…)
Slope of Hope Blog Posts
Slope initially began as a blog, so this is where most of the website’s content resides. Here we have tens of thousands of posts dating back over a decade. These are listed in reverse chronological order. Click on any category icon below to see posts tagged with that particular subject, or click on a word in the category cloud on the right side of the screen for more specific choices.
An Easy Target to Remember
Carnage at the Bank of England
The Bank of England has a new Governor and his first act has tidied up my ambiguous forex charts nicely. Mark Carney was the Bank of Canada’s Governor from February 2008 and was widely credited with Canada’s seeming immunity from the 2008/9 financial crisis. Of course much or all of that credit should really go to his predecessor David Dodge who was in office from 2001-8, and avoided the mistakes made by the Fed and BOE over that time. Mark Carney can however take credit for much of what lies in store for Canada over the next few years, which currently looks a great deal less promising. Having been chosen by politicians though the man hired to sort out the BOE is not the man who actually delivered stability to Canada during the 2008/9 Financial Crisis, but just the man who took the credit for it. (more…)
Inflection Point Here
I’ve been saying since the SPX broadening ascending wedge from the November low broke that we were unlikely to see a break back above broken wedge support before the retracement low was in. Broken wedge support was tested at the high yesterday and obviously hasn’t broken as yet. Here’s the chart I posted on twitter just after that high showing the declining channel that was also established at that test. SPX 60min chart (intraday yesterday): (more…)
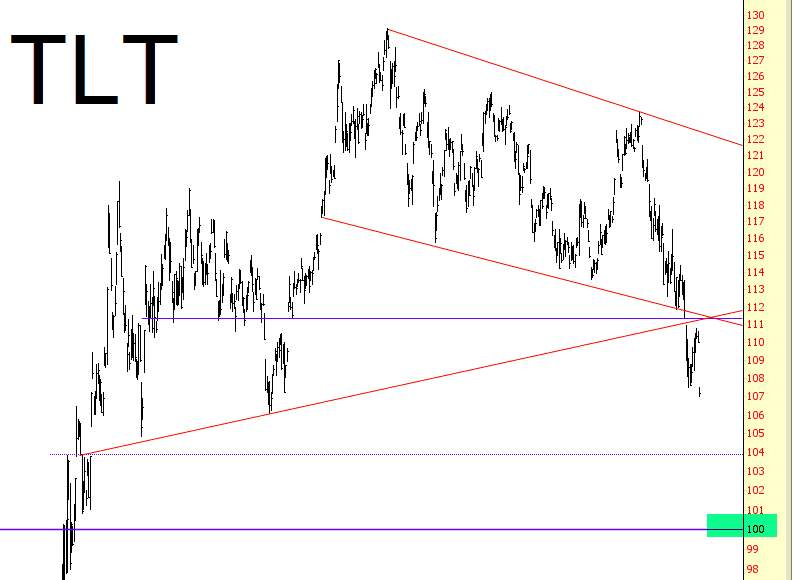
Bond Outlook
As with just about every other asset class, bonds have been bouncing strongly over the past week, but I think that – – again, with just about every other asset class – – the bounce is nearing an end. Take note of the descending channel bonds were trading within ever since last May. It broke the channel on June 19th, and I think the lower trendline is going to represent resistance now. We are approaching this trendline, as well as another spanning back to August 19, 2011, which I believe provides a strong pivot point to repel prices downward. (more…)
