The only meaningful short I had entering the day was TLT, and it's doing pretty well. I think the ZB contract is going to head toward about $146, now that support has finally been broken.
Slope of Hope Blog Posts
Slope initially began as a blog, so this is where most of the website’s content resides. Here we have tens of thousands of posts dating back over a decade. These are listed in reverse chronological order. Click on any category icon below to see posts tagged with that particular subject, or click on a word in the category cloud on the right side of the screen for more specific choices.
Possible Bull Breaks (by Springheel Jack)
We saw some big moves last week on the basis of talk by Draghi, backed up by Merkel, that the ECB would take whatever action necessary to save the Euro. Talk is cheap though and Merkel hasn't yet confirmed that she will accept the ECB printing money to save sovereign EU nations in trouble. I suspect she won't, and unless she does this move doesn't look likely to last long. Be that as it may some interesting things happened from a technical perspective last week so we'll go through those.
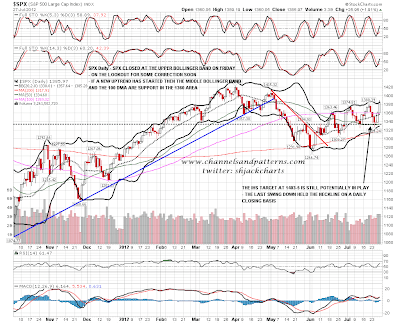
On the SPX daily chart the SPX closed at the upper bollinger band on Friday. This is an obvious time to look for some retracement though I note the overnight action on ES looks like a bull flag so far. If a new uptrend has started then there should now be strong support in the middle bollinger band and 100 DMA area around 1360:
Bullish Options (by Springheel Jack)
Well we got the test of the last SPX low that I've been looking for, but we haven't seen that low broken yet, and the RSI setup on the 15min and 60min charts looks promising for a bounce so we'll see. On the daily chart SPX found some support at the 50DMA and closed above the 1335 IHS neckline again. That neckline has now been tested so many times that I'm inclined to write the IHS off altogether, but at the least it is obviously a very strong support level. If we see more downside the lower bollinger band and the 200DMA are at 1320 and 1315 respectively:

Looking Overbought (by Springheel Jack)
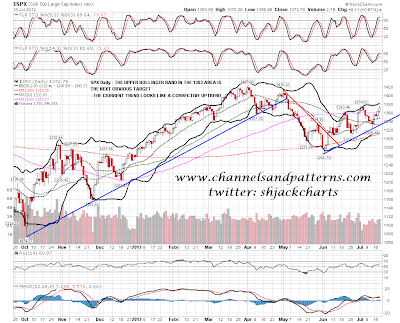
A shortish post today as I'm still feeling a bit drained from returning yesterday from holiday and have a headache today. Looking at the SPX daily chart the current move up from support at the 50 DMA is close to reaching the upper bollinger band in the 1383 area. If the current move peaks like the last two then that would give a likely upside target in the 1385-90 area:
Looking at the 60min chart we have a solid uptrend with higher lows and highs, though this still looks like a corrective rally rather than an impulsive move towards new highs. The rising wedge that was looking very promising a couple of weeks ago has faded and there's no current pattern worth mentioning other than a possible double-top here, currently at the wild speculation stage. People have been talking about a possible cup and handle formed from the lows last month. I see it but the quality looks poor, so I'm disregarding it:

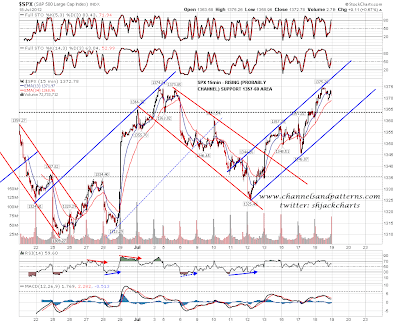
On the 15min chart I have a nice looking rising channel from the last low. I have channel support in the 1357-60 area today but I'm really looking for another push up to establish negative RSI divergence and set up the next short term high, ideally in the 1385-90 area as I mentioned looking at the daily:
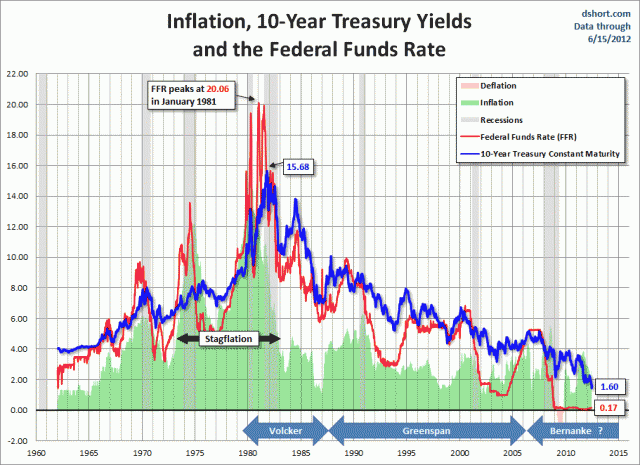
I've been looking at bonds carefully this morning. The possible double-top on TLT and ZB that I was talking about a couple of weeks ago has set up, and while the overall picture on bonds looks bullish that's worth bearing in mind as a possibility. The signal for this playing out would be a conviction break below very firm support at 124 on TLT. Looking though at my 30 year declining channel on 30yr bond yields (TYX), you can see that TYX is still testing support at the 2008/9 lows, with the obvious target on a break below at channel support in the 1.7-8 area. That seems the more likely outcome here:

Would that be bearish for equities? Somewhat I think, though it's worth noting that TYX reached the last peak in early 2011 while SPX was trading in the 1300-1350 range. Since that time long term bond yields have almost halved while equities have slightly increased. Short term on SPX the current move looks to be topping out and though I'm looking for a bit more upside before a substantial retracement short term longs are starting to look risky here.
Three Decades Into Secular Bull In Treasuries
A Striking Chart From SocialTrade
Hey Fellow Slopers,
Checking Social Trade on Wednesday, I found this striking chart posted by INVESTNBEST, showing the secular bull market in 10-year Treasuries over the last three decades: (click to enlarge)