Slope of Hope Blog Posts

Slope initially began as a blog, so this is where most of the website’s content resides. Here we have tens of thousands of posts dating back over a decade. These are listed in reverse chronological order. Click on any category icon below to see posts tagged with that particular subject, or click on a word in the category cloud on the right side of the screen for more specific choices.

Symmetry

By -

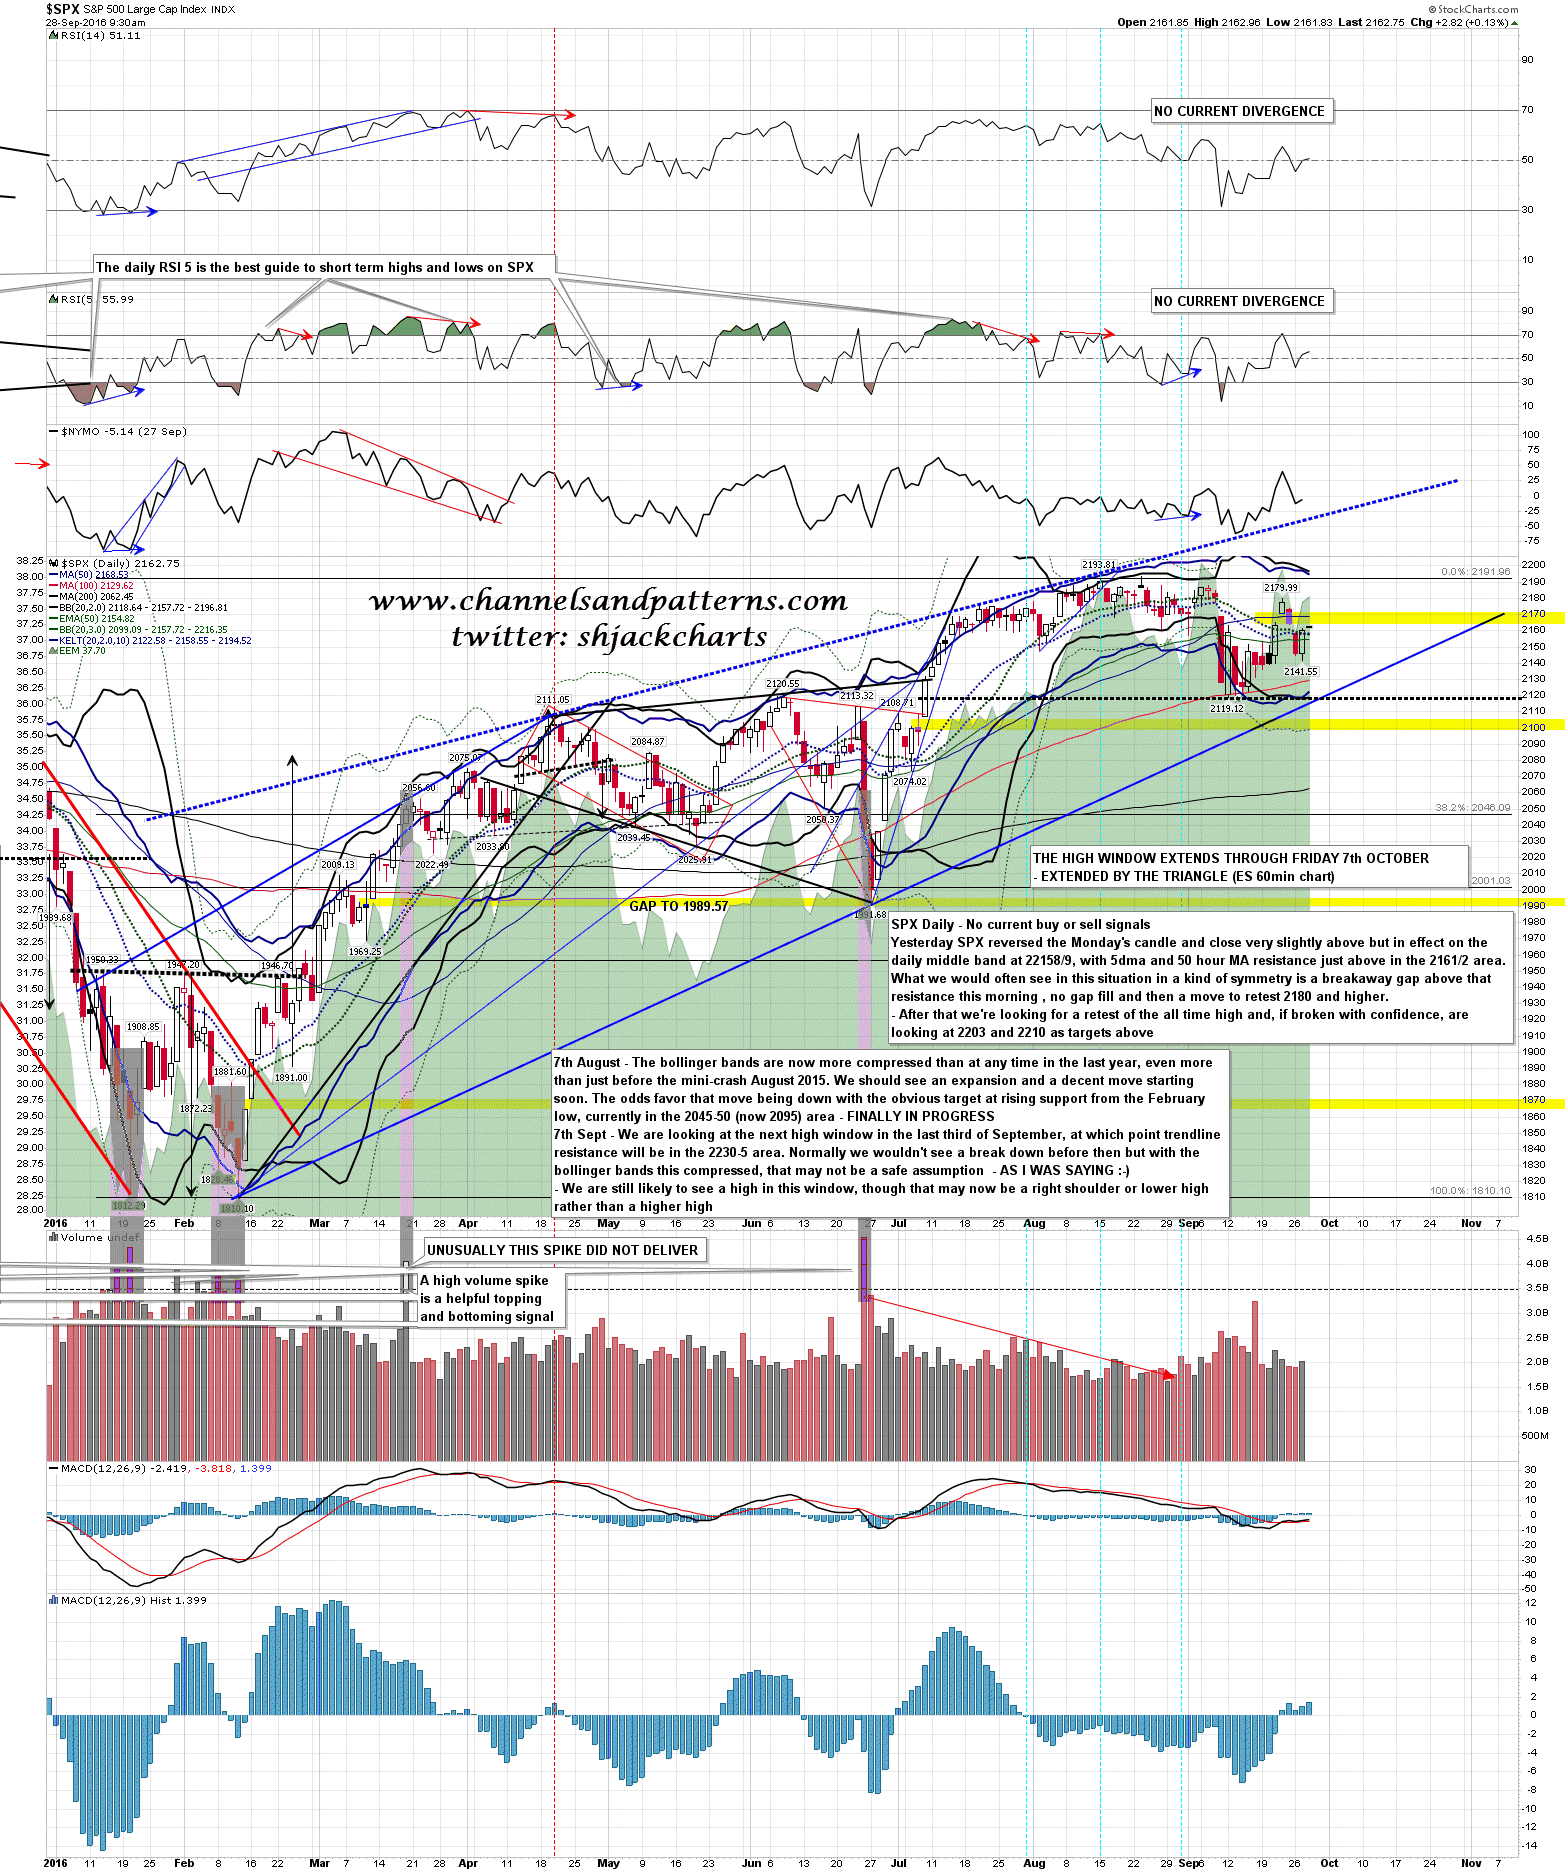
SPX made a marginal lower low yesterday as expected and then rallied back into main resistance at the daily middle band, which closed yesterday at 2158/9, with the 5dma and 50 hour MA slightly above in the 2161/2 area. SPX closed a handle above the middle band but in practical terms I count a close less than two handles away from the band as a close on it.

One thing you often see in this kind of situation is a kind of symmetry where unusual setups can repeat several times in a short period and we might have a situation like that here. The last two times that the middle band was tested SPX gapped through it and at the open today SPX has gapped through it again. Both of the last two gaps were breakaway gaps that did not fill that day or the day after. We may see that again today and, if so, that would be a strong start to the ATH retest that we are expecting. SPX daily chart:

160928 SPX Daily

(more…)

BoJ, FOMC and Where to Now?

By -

Below is the opening segment of the September 25 edition of Notes From the Rabbit Hole, NFTRH 414

The Bank of Japan gave us a glimpse as to just how far down the rabbit hole we may have to follow global policy makers as we try to make sense of ever more complex and shall we say, innovative ‘tools’ being used in the effort to engineer individual economies and asset markets within the global financial system. BoJ announced it would conduct “JGB purchase operations” in order to “prevent the yield curve from deviating substantially from the current levels”.

The market initially interpreted this to mean BoJ stood in support of a rising yield curve, which would for example, help the banks (ref. MTU and SMFG, which exploded higher off of the support levels we had projected), but by the end of the week the Japanese Yield Curve had eased substantially and there seemed to be confusion about what the policy’s intent, or would-be effects, actually were. I wonder if the BoJ even fully knows what it is doing now. Lots of moving parts in a complex system.

(more…)

Entering The High Window

By -

The high window opens on SPX today and runs through to Monday 3rd October. During this period Stan and I are expecting to see a very significant high made that would then be followed by a decline that would be considerably larger than the modest retracement just completed. We are looking for a likely full retest of the all time high, with an eye on higher targets in the 2203, 2206/7 and 2210 areas.

On the daily chart SPX confirmed the break back over the daily middle band with another close above it yesterday. This opens a possible test of the daily upper band, currently at 2202. I’d generally expect to see a retest of the middle band from above today or Monday, and that is currently in the 2161 area. SPX daily chart:

160923 SPX Daily

(more…)

Three Day Rule – Day Three

By -

All charts and video today done last night or this morning for subscribers at theartofchart.net.

SPX spent much of Friday under the 5dma, but rallied to close on it, so the three day rule was not triggered. Bears have a second and last chance today to close more than two handles below the 5dma, currently at 2138.10. If they can then the rule states that we see a retest of the current retracement low at 2119 and likely go lower. If they can’t then the retracement low may well already be in and SPX likely rallies into the high window that opens on Thursday 23rd September, ideally retesting the current all time high or going a bit higher into the 2210 target that Stan and I are looking at. SPX daily 5dma chart:

160918 SPX Daily 5dma

(more…)

To B Or Not To B

By -

One thing that Stan and I are both bad at is drawing attention to our successes, as that feels like bragging, and we both know that good technical analysts are very prone to getting delusions of grandeur, which has a very negative (and often fatal) effect on the future quality of their work. We have no intention of going down that road ourselves.

However a certain degree of self-congratulation seems necessary for marketing purposes, so with some reluctance I’m going to be mentioning some current and past successes along with my equity index analysis today just to demonstrate what it is that we do at theartofchart.net. I’m going to be doing a post there later showing some seriously nice past calls on AAPL to promote our new Big Five (AAPL, AMZN, FB, NFLX, TSLA) chart service that we are launching at the moment, and if you’d like to attend the free public webinar that we are doing on Monday after the RTH close to promote that service then you can register for that here. We will be looking at the charts for all five in that free webinar. (more…)