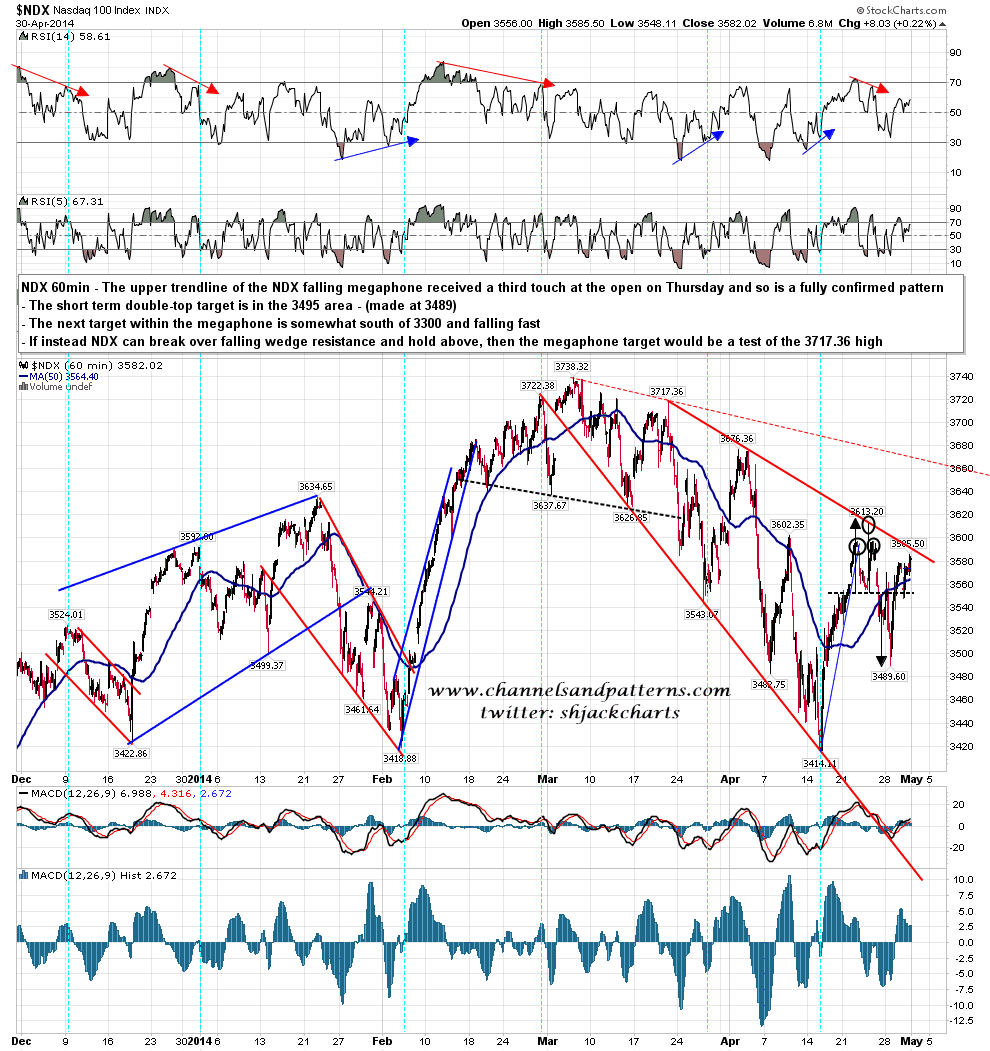
The bears have had some decent opportunities this week, but each time the bulls have reeled them back and pushed up a bit further. With just a little more upside NDX is close to another test of falling megaphone resistance, and if NDX can break over that and hold above that trendline, then a major obstacle to more upside is cleared. NDX 60min chart:
Slope of Hope Blog Posts
Slope initially began as a blog, so this is where most of the website’s content resides. Here we have tens of thousands of posts dating back over a decade. These are listed in reverse chronological order. Click on any category icon below to see posts tagged with that particular subject, or click on a word in the category cloud on the right side of the screen for more specific choices.
Pigs No Longer Fly; What Are the Implications?
Along with the highly publicized loss of leadership from big tech, the US stock market is now in danger of losing another, and possibly more important leader, the piggies or banking sector.
While the weekly chart of BKX has not yet broken down, it is very close to doing so after sporting a negative RSI divergence for the better part of the last year. We should not jump the gun with bearish scenarios, but as always we want to be among those looking forward and ready, just like in 2007, which was the last time BKX-SPX began to roll over in earnest.
Tug of War
The only two kinds of TA that I refer to every day are classical charting, mainly my own, and Elliot Wave. For EW I don’t of course use Prechter and EWI, as Prechter’s analytical skills have long been eclipsed by his faith that we are in some kind of apocalyptic ending move which is the climax of a massive 5 point move up from 1500 AD, or 500 AD, or whatever. I’m not one to mock the religious beliefs of another, but faith has no place at all in analysis, so while Prechter stands on his lonely mountain top waiting for the end of the world as we know it, I’ve been ignoring him and watching the calls of my very capable EW chartist friends Pug and Alphahorn. (more…)
Breaking Back Up
That was an interesting day yesterday and SPX reached the targets I was talking about in the morning at the retest of the 50 hour MA and broken rising channel support. The high falls between two fibonacci retracement targets but otherwise is a model rally high. SPX 60min chart:


