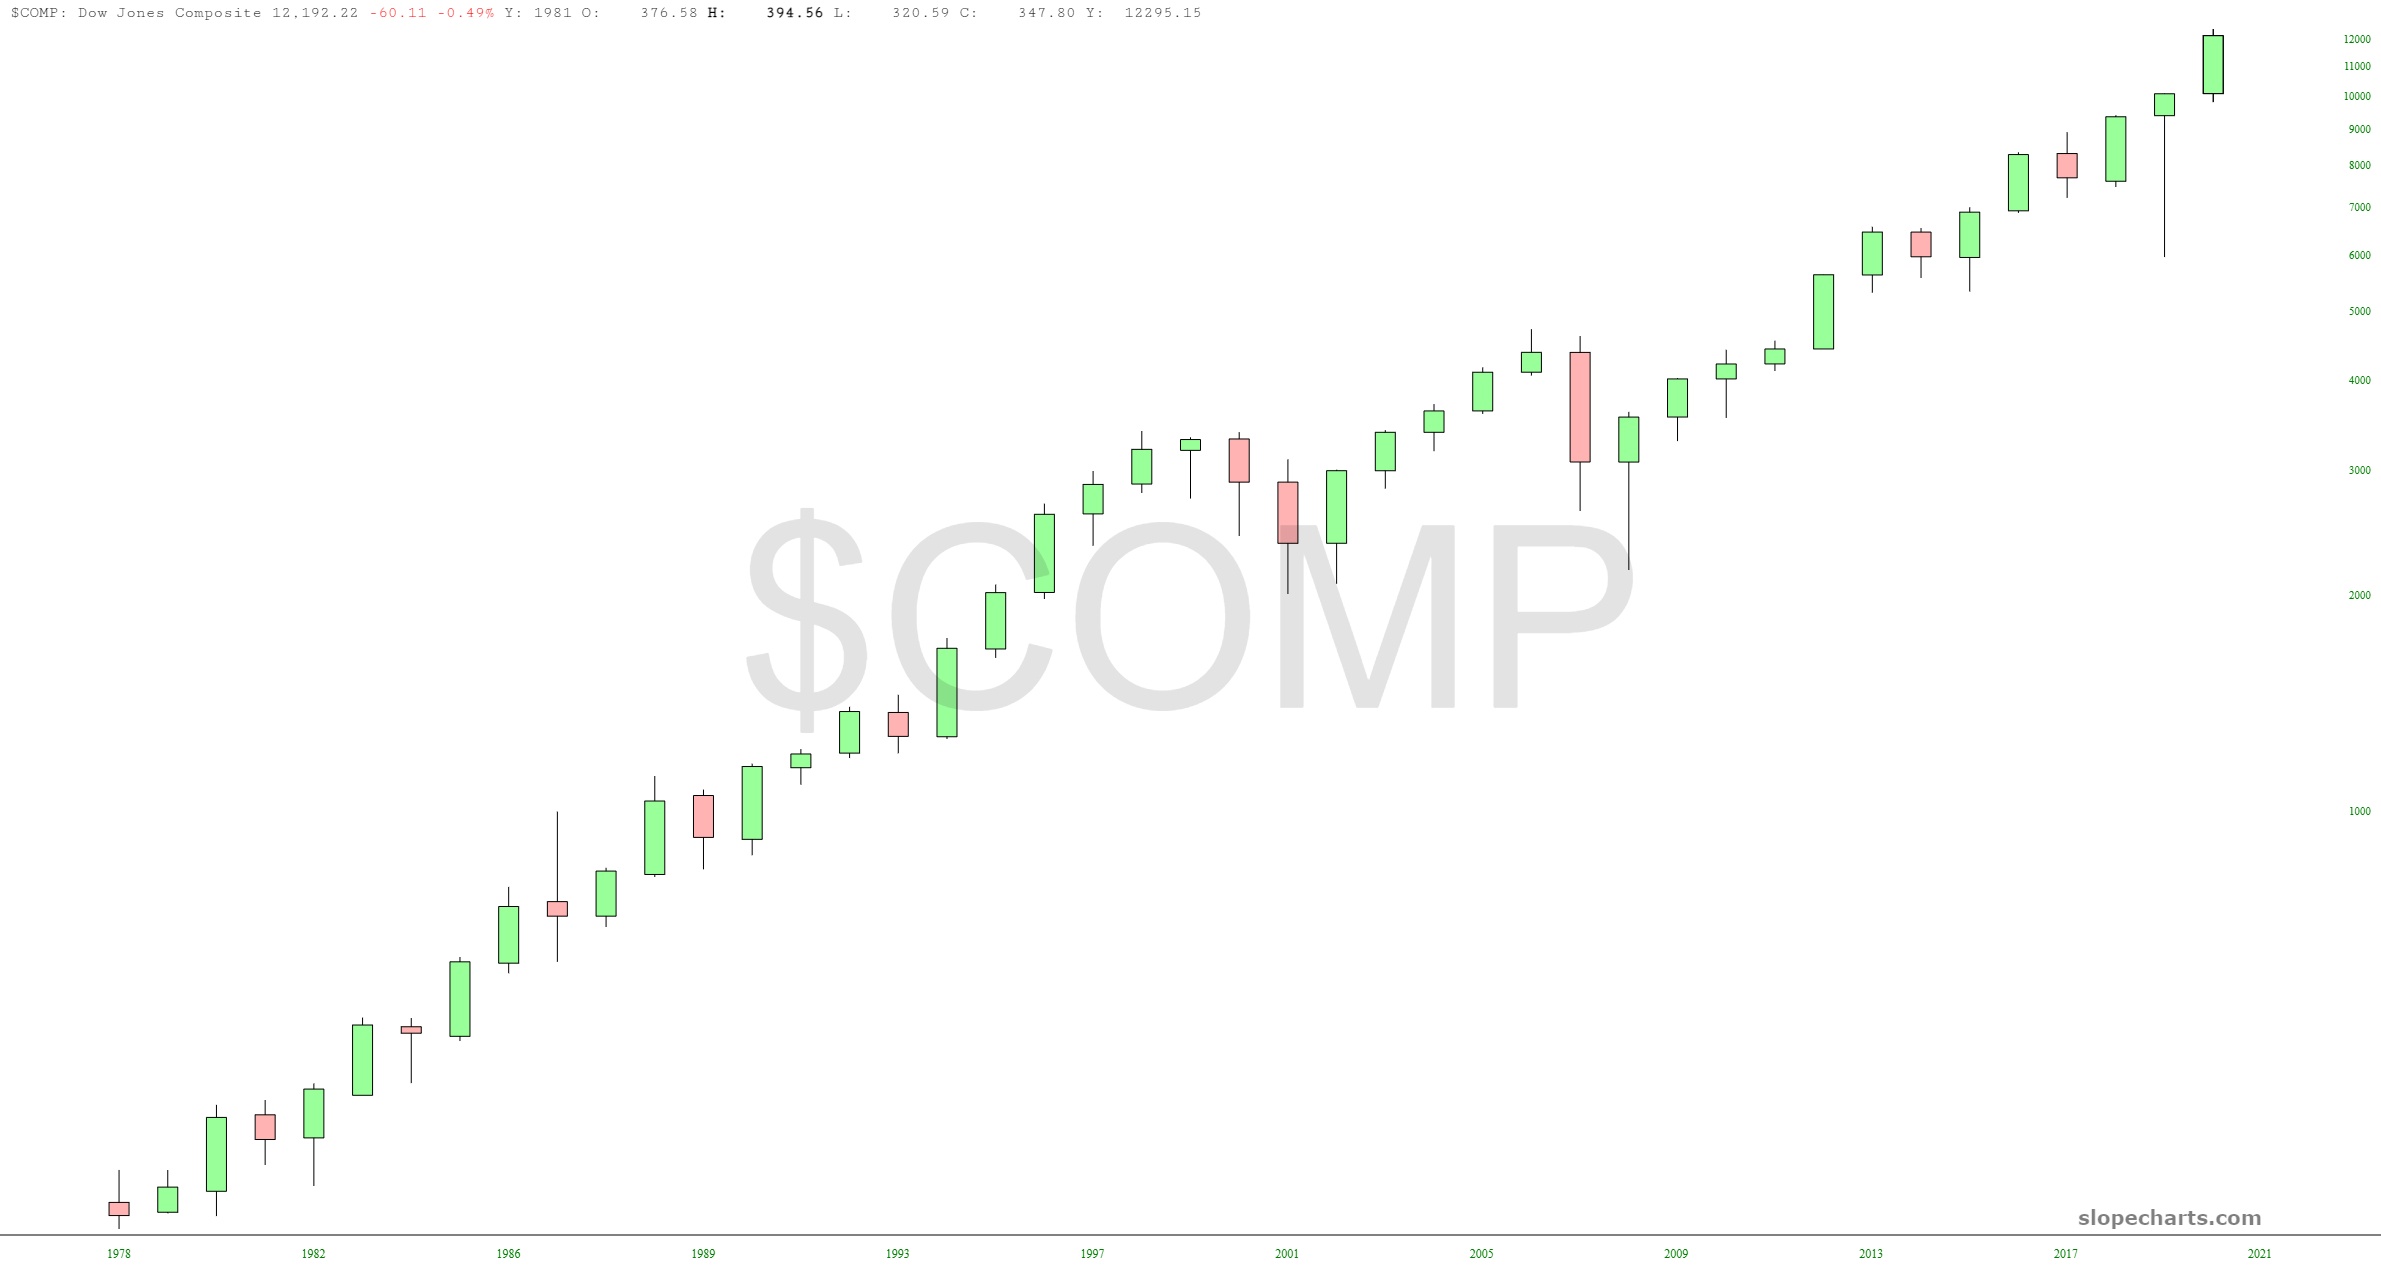
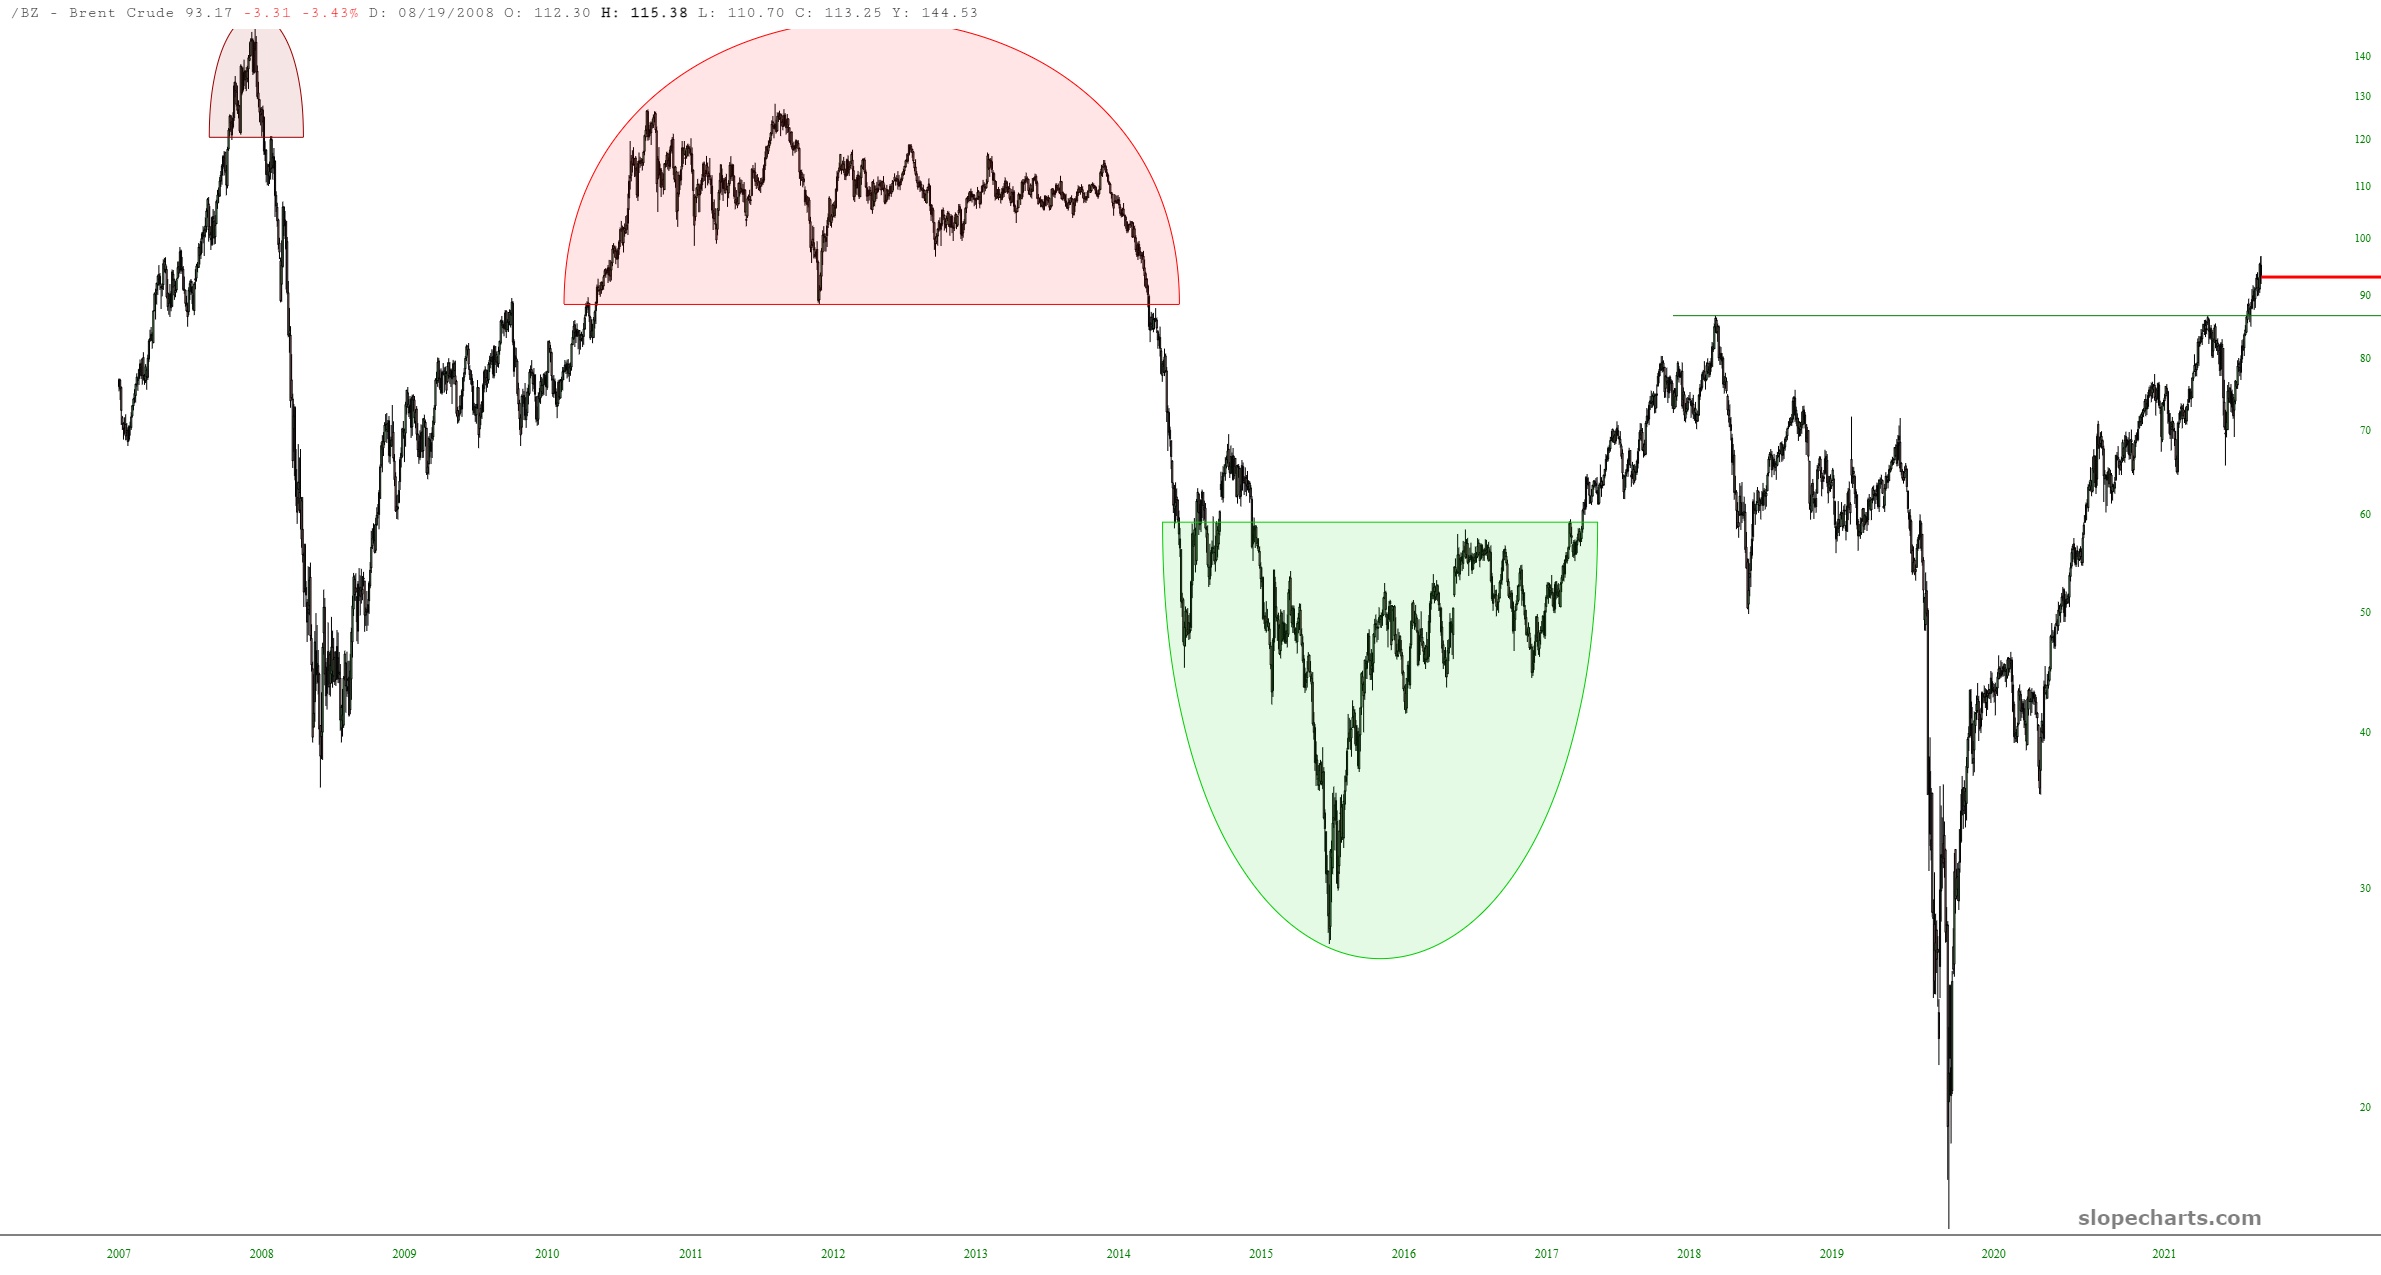
It’s big picture time! Here are nine important futures markets with many decades of data:
Slope initially began as a blog, so this is where most of the website’s content resides. Here we have tens of thousands of posts dating back over a decade. These are listed in reverse chronological order. Click on any category icon below to see posts tagged with that particular subject, or click on a word in the category cloud on the right side of the screen for more specific choices.
It’s big picture time! Here are nine important futures markets with many decades of data:
I’ve been promising a post talking about the January Barometer, which is a statistic from the Stock Trader’s Almanac, something that I have been buying every year for many years as it has a lot of very useful information for traders and investors.
This statistic looks at all Januarys that have closed down since 1950 and what happened over the rest of the year from there, and on those years overall. The stats for the rest of the year are that 59.7% of them close down for the overall year, and 48.7% close the year lower than that close at the end of January, which was at 4515.55 this year of course.
(more…)[edit] Since this article will be distributed to a wider viewership than nftrh.com, where regular readers know I take pains not to hype this most precious ‘value’ asset, take note that a positive risk vs. reward does not mean run out and go whole hog gold stock bull right this minute. Risk vs. reward is a condition, but not a timer. The miners, as of now, are on a seasonal bounce/rally. But with patience, the sector is setting up to distinguish itself as unique and quite bullish in 2022.
As today’s (Thursday’s) market activity shows, the bubble is still in force as US stock markets/sectors generally remain intact (for the most part, with some notable exceptions outside of the headliners, as certain table legs get kicked out). But gold is in a beautiful Cup & Handle structure, as I’ve shown repeatedly (ref. 2022: The Golden Year) since NFTRH began projecting the handle-making in the summer of 2020.
What’s more, gold’s ‘real’, commodity adjusted price has been declining since the overdone 2020 upside as well. Risk is with commodities (and stocks) and reward – with patience – is with gold and when they leverage a future macro, gold stocks.
(more…)In my post on Friday 6th August I was looking at a possible backtest scenario on SPX that could be setting up and I’d like to review how that is looking on my first post this year, as I think that backtest may well be delivered over the next few weeks.
That backtest would be of a huge resistance trendline on SPX that broke at the end of 2021 / start of 2021, and is currently in the 3850 – 3900 area. The break over that trendline may have been a break up over a rising megaphone resistance trendline with a target in the mid 6000s on SPX , but if that is the case, to confirm that target, the trendline would need to be backtested and hold into new all time highs on SPX.
(more…)That’s it, ladies and gentlemen. It’s over. Below are a variety of major ETFs and indexes, deliberately display with yearly price bars, just to give a crude, big-picture view about the record-breaking year that just ended.