
I’ve been promising a post talking about the January Barometer, which is a statistic from the Stock Trader’s Almanac, something that I have been buying every year for many years as it has a lot of very useful information for traders and investors.
This statistic looks at all Januarys that have closed down since 1950 and what happened over the rest of the year from there, and on those years overall. The stats for the rest of the year are that 59.7% of them close down for the overall year, and 48.7% close the year lower than that close at the end of January, which was at 4515.55 this year of course.
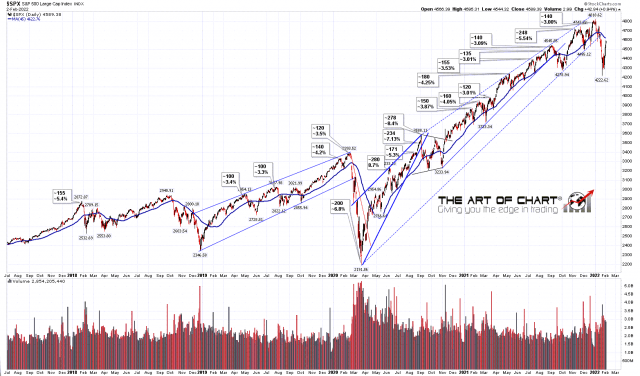
The most interesting statistic for me though is that on average the low for those years is 13% below that January close. Now that’s only an average, but that would put the average expectation for a low on SPX this year in the 3929 area, and I wrote a post last August looking at a retracement I thought we might well see on SPX this year to backtest a big broken resistance trendline on the SPX monthly chart, a trendline that I currently have just under 3900 and rising. That won’t necessarily be tested this year of course, but historically that test is now most definitely on the table as a serious possibility. We’ll see how that goes.
I was reviewing the prospects for that possible backtest again in my post on 10th January, and if you’d like to read that you can find that here.
In the shorter term the rally on SPX that I was looking for returned to main daily resistance at the daily middle band and broke back over it yesterday.
If SPX can convert the daily middle band to support, and then the weekly middle band, currently at 4577, back to support, then that would open up a possible retest of the all time highs. Before that really comes into view though those breaks would need to confirm with another close above on the next candle, which they often fail to manage, and when these don’t confirm that it tends to fail with a break back below the middle band on the next candle, so for the daily middle band that would be today. With SPX currently back below the daily middle band at the time of writing that looks like a real possibility today so we’ll see how that develops over the rest of the day. If it fails to confirm that break today then that fail would usually follow through to the downside.
SPX daily BBs chart:
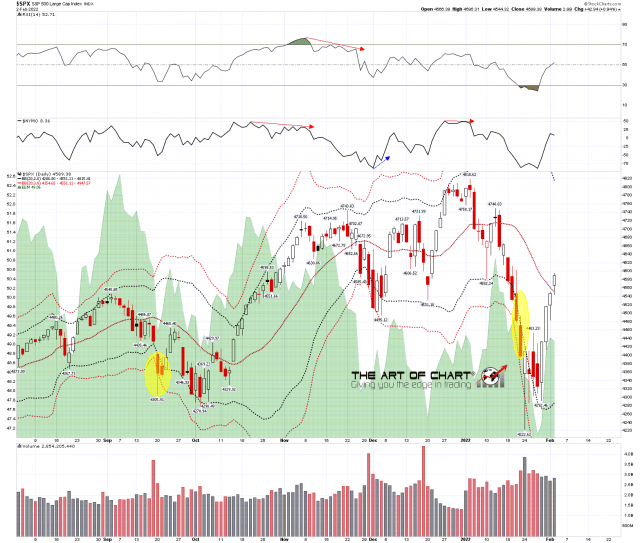
In the event that we do see SPX go up further from here I would note that above the weekly middle band I have the reversion to the mean level at the 45dma currently in the 4623 area.
SPX daily vs 45dma chart:
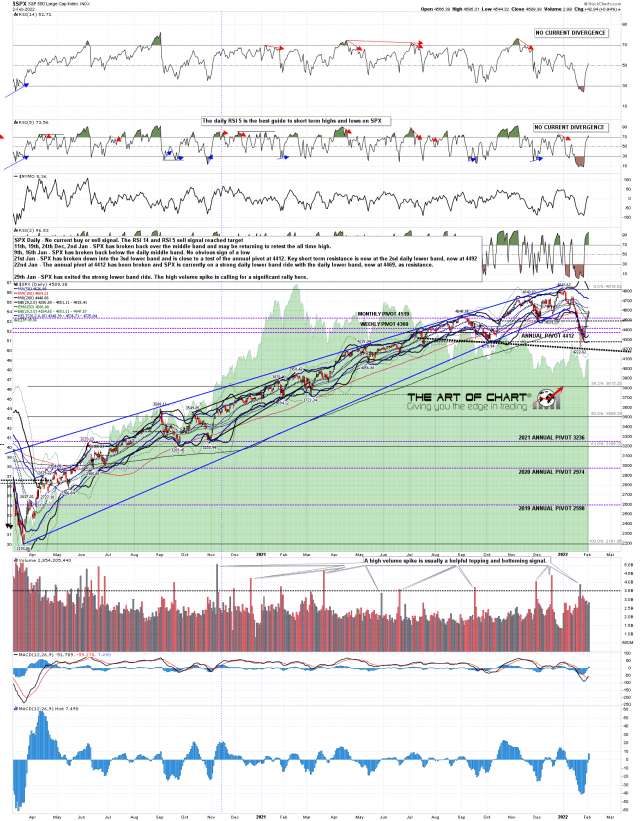
On the SPX daily chart there was no positive divergence at the low, and the rally high yesterday was over the 50 level on the daily RSI 14, so there is no prospect of getting good quality positive divergence on a retest of last week’s low. I would note the possible H&S forming here on SPX that on a sustained break below 4200 would have a target in the 3550-3600 area. That’s lower that I’m expecting to see this year but I’m watching it with interest.
SPX daily chart:
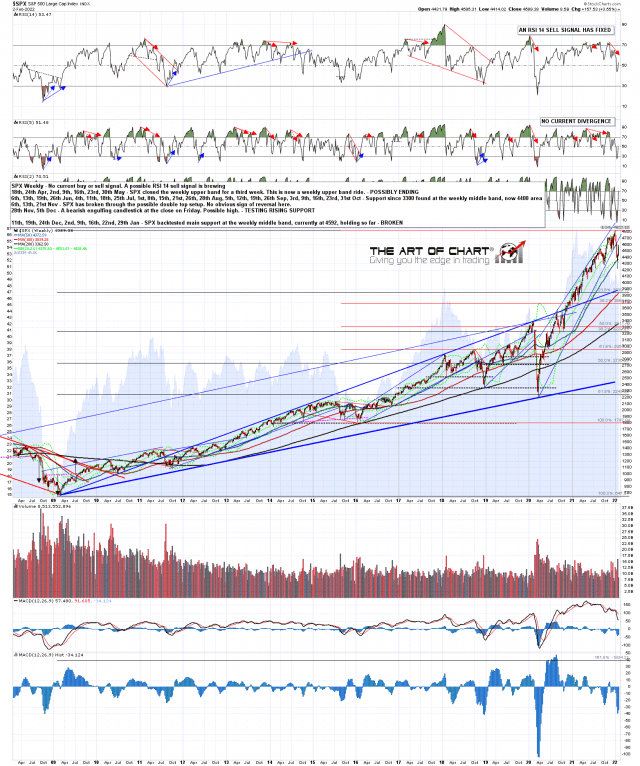
On the SPX weekly chart I’m watching the weekly middle band, currently at 4577 as I mentioned above, and while not many analysts tend to watch this it is nonetheless one of the key support and resistance levels on both SPX and NDX. NDX was testing it as support at every significant low last year. A confirmed break back above, if seen, would be a strong signal for a retest of the all time high.
SPX weekly chart:
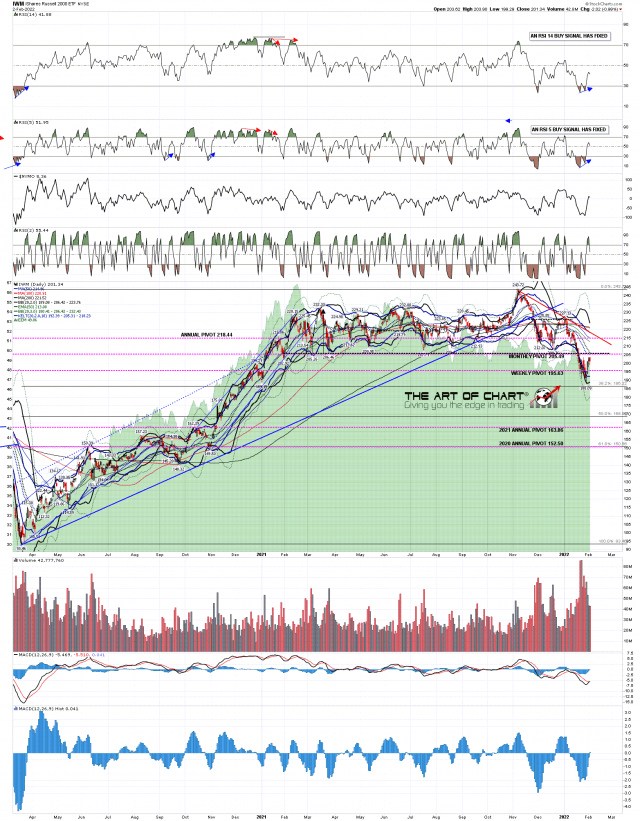
The only main US index on daily buy signals is the Russell 2000, shown below on IWM. That’s mainly because it has been the weakest index for a while, and therefore delivered the low retest that was missed on the others. There is a possible IHS right shoulder forming there too that I will be keeping an eye on.
IWM daily chart:
We are doing our monthly free public Chart Chat at theartofchart.net at 4pm EST on Sunday and will be looking at the options here more there, as well as looking at the usual wide range of markets. If you’d like to attend you can register for that here or on our February Free Webinars page.
