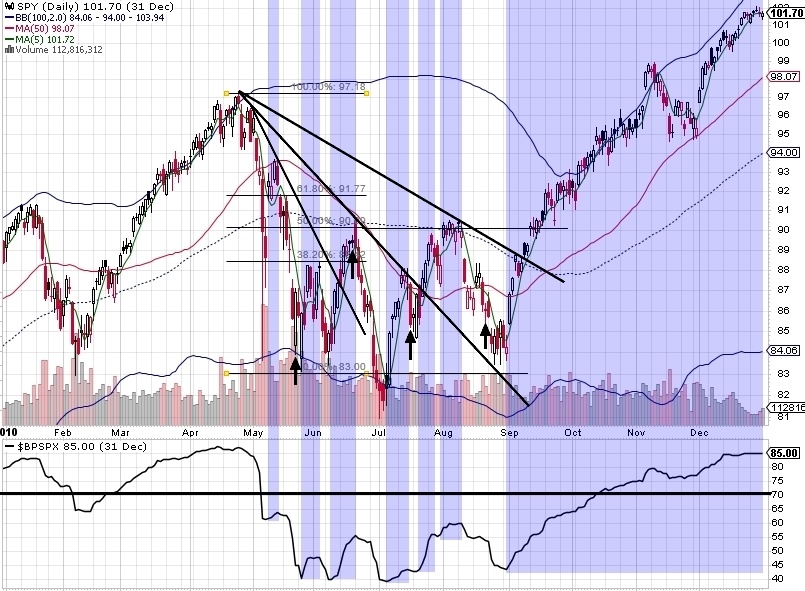
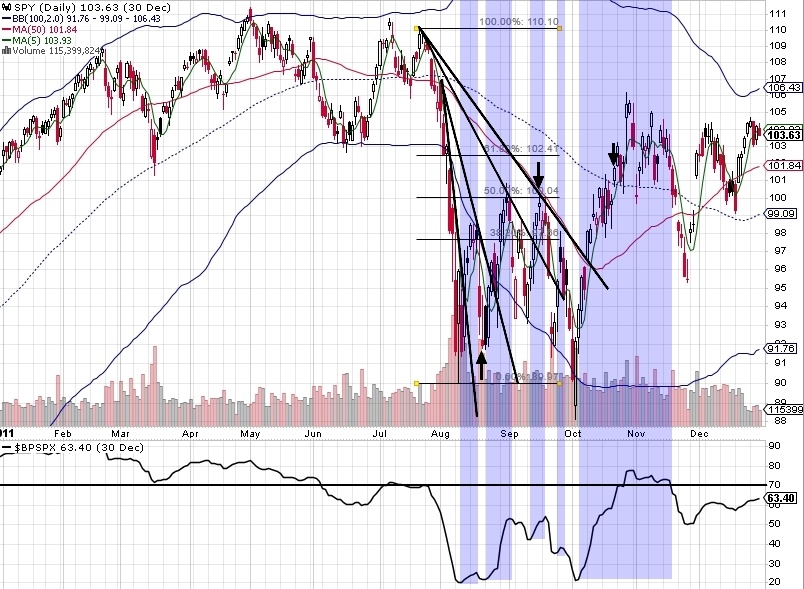
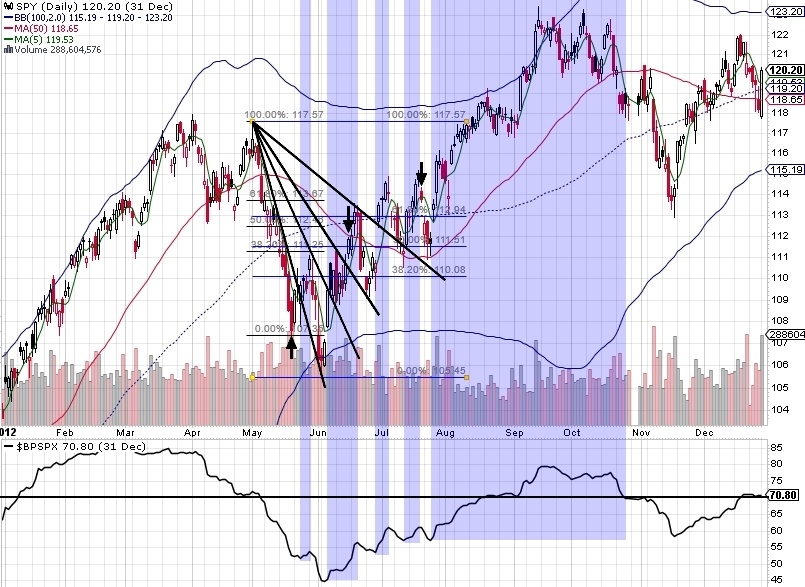
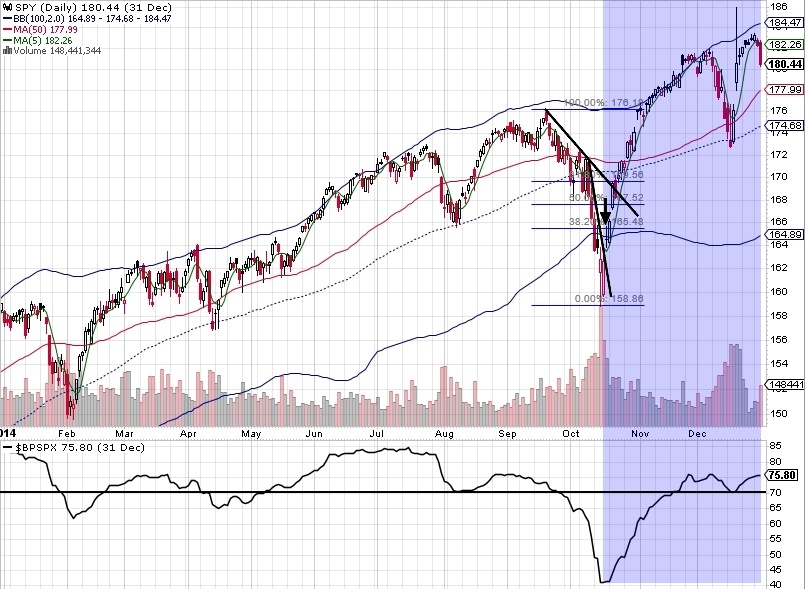
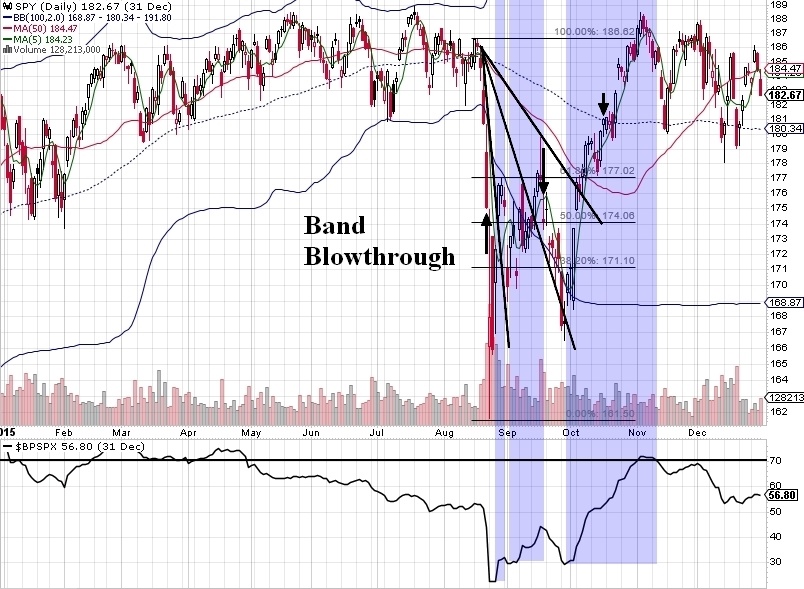
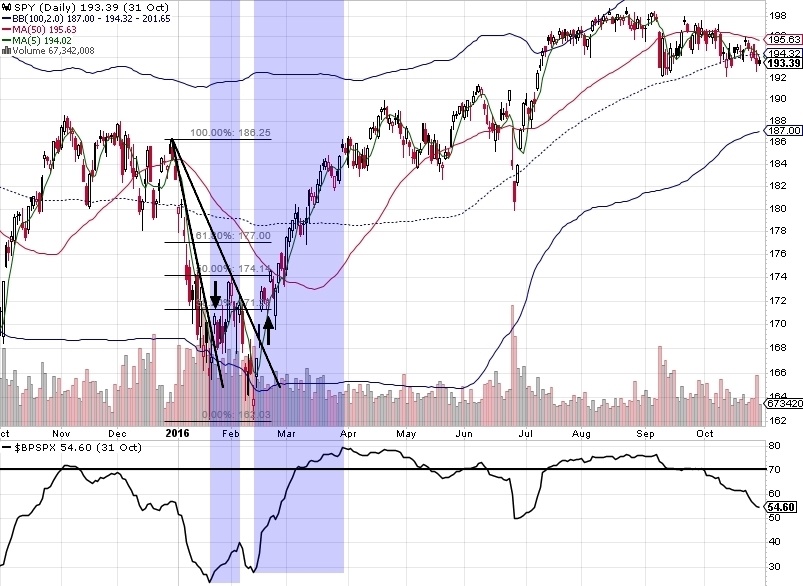
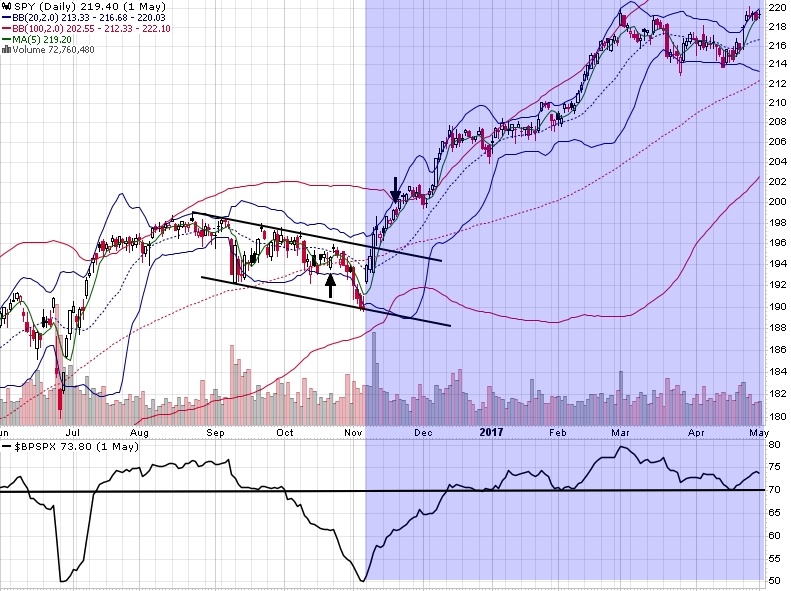
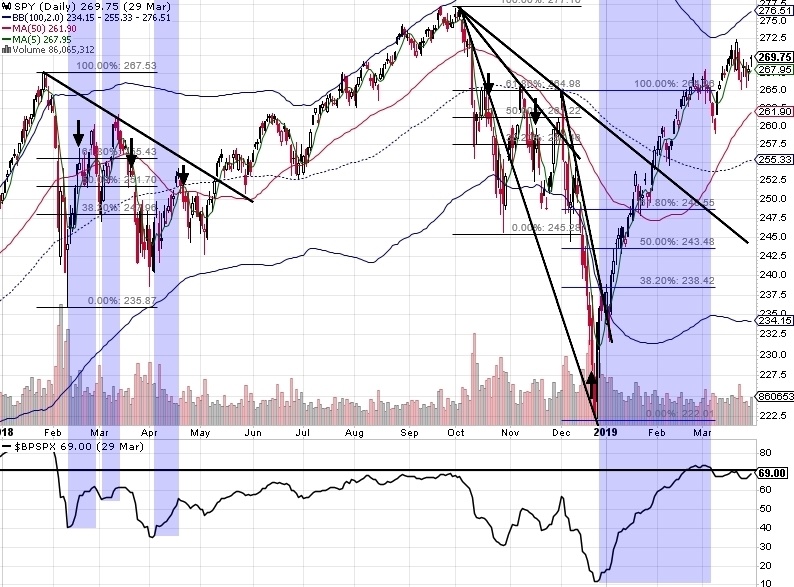
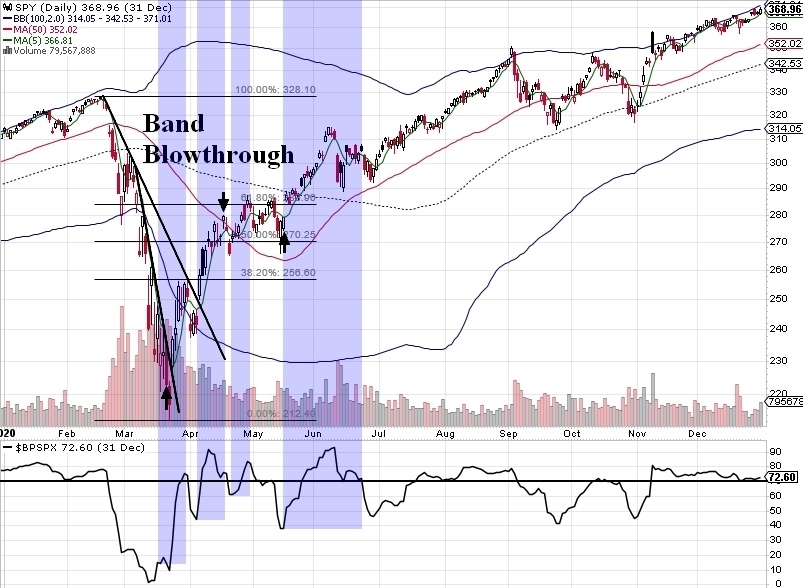
The lower weekly Bollinger bands are a common extreme target in most major corrections. In fact, I note only nine such tests since the 2009 bear market low. I looked and looked for some kind of reliable method to determine ahead of time how a correction would likely unfold (such as in being range bound for a while or breaking out and resuming the uptrend), but I could not find any consistent outcomes by looking at how high the VIX got, whether there was a weekly band low blowthrough or not, or how deep the correction was. There were no commonalities I could find on how high a first bounce would likely go or whether or not it would retest the low.
Below I am posting all nine corrections for you to study with a few additions for context. I have ommitted years where there was no weekly band low test and let a couple through that were either very close or severe in nature. Highlighted blue are the areas where the Bullish Percent Index (the lower indicator) is moving up showing that more and more stocks are gaining strength by breaking out which tends to pull price up along with it. OpEx Days are noted with bold arrows.
Since I couldn’t find any common factors for judging outcomes, I will offer the methods I find most useful for navigating such a volatile environment.
Probably of first importance to me is having a read on the type of day, whether buyers or sellers are in control (breadth data, percentage of advancing issues, the bullish percent index, the VIX), and what price is doing on shorter timeframes (higher highs or lower lows, MA’s on the hourly).
Secondly would be price structure. You’ll note that on many of the corrections, I have drawn in fan lines. These create great highly reliable reference points for the health of a trend. If the trend line isn’t broken, then the trend isn’t broken. Seems simple, right? The only thing to watch after that is how extended price is from MA’s. There is a point individual to each stock/index where shorting is low odds and buying is low odds. A return to a trend line is an excellent reference point where buyers or sellers demonstrate who is in control and decisions can be made with lower risk. My favourite of all is the retest after a DTL break. It’s possible to have a very tight stop on the touch with excellent reward potential. I DO NOT recommend front running it, but waiting to see that it holds and then joining in.
Thirdly, it is useful for me to note OpEx days because there is a high tendency for price to turn near it. Notice that nearly every single major correction ENDED near or on an OpEx day. This has to do with the double selling effect of dealers hedging puts that are being bought by customers by selling futures and/or stock. However, once OpEx passes and much of these options expire, the hedges are no longer needed so the dealer buys them back which is why you so often see these rocket moves up after OpEx. A similar and opposite effect can happen when there is a large move up into OpEx, the dealer is hedging calls being bought by customers by buying futures and/or stock and once they expire, the dealers unload them the following week. It’s not a 100% occurrence, it depends a lot on whether the majority of expiring options are in-the-money or out-of-the-money as well as how many of them there are.
To put this in context, here is the current correction-in-progress as I see it:
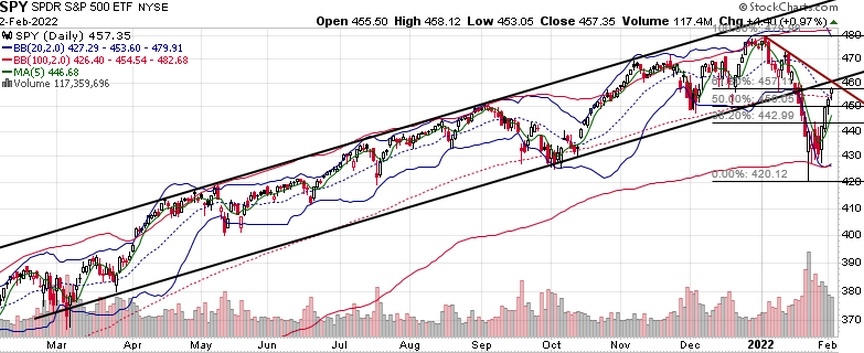
Structurally: Price is nearing the channel retest as well as the 61.8% retracement of the decline AND we’re in the vicinity of the 20wkMA (justed tested and held it today actually). Each day’s range has become smaller and smaller which says to me the rally is running out of gas a bit and needs a consolidation period or pullback. I like this area for a potential turn.
On the day read: As of the time of this writing (Wed night), I’m going to have to be patient a few hours yet. Despite facebook’s disappointing earnings report, indices are holding up. Ideally, I would like to see a pop up first thing in the morning into resistance and see internals starting to give up ground. I’ve already placed a morning order to close out my one long position if price pops before I can get to it. If there are signs of selling across the board and I can get a reasonable entry point to define my risk, I will certainly short something.
OpEx: One note about OpEx, volatility has a tendency to mess with the standard reliable flows that occur as we get closer to OpEx, they become much more sporadic or don’t show up at all. That is the caveat to the typical “window of strength” we are now in being two weeks to VIX OpEx (in calmer markets, most of the long premium is already mostly gone by Wed of OpEx week). The “window of weakness” which represents the rest of the OpEx cycle does NOT mean SELLING, but simply an absence of these passive buying flows. So my read here is largely dependent on what the market does in this window. If volatility increases, things “could” go to hell in a handbasket, but if volatility stays suppressed and the beginning of day and end of day OpEx flows can stay in place, we might just be in for a consolidation period. We’ll just have to see.

