
Before I get started I want to encourage all of you interested in trading options to sign-up for my free weekly newsletter. No, I’m not going to send you more than the one email a week and no, I’m not running a service. I’m a trader. This is completely free from all marketing. You will find educational topics, research, trade ideas, weekly indicators and more each week. I’ve been on Slope for a long, long time and would love your all of your support. Thanks.
Click the following to sign-up for:
No one truly knows where the market Is headed over the next three months, six months, one year or longer. And it’s a fool’s game to even try.
When I hear someone prognosticating on the direction of the market I’m immediately reminded of an incredible infographic I came across years ago on the performance of the stock market. And every, and I mean EVERY, investor or options trader should take a look at this infographic before investing another dollar. Because once you do, you’ll immediately begin to change your investment outlook. But, more importantly, how you will invest going forward.
Ed Easterling, founder and president of Crestmont Research, published an eye-opening infographic that has changed the way informed investors approach the market, FOREVER.
What Mr. Easterling’s data displays is simple: the buy and hold strategy that most investors are accustomed to following has major holes. Holding securities for the long haul isn’t a guarantee of profitable results. Results depend on “when you start and when you finish.”
This is why I take an approach that uses a diversified group of strategies that take advantage of different market environments. I use these strategies simultaneously, focusing not so much on direction, but on probabilities. The probabilities, especially when using probabilities 68% and above, afford me the ability to be completely wrong in the directional assumption of the strategy/trade and still make a return. And when volatility is on the high side like it is now, well, that margin of error can increase significantly.
Which brings me to today’s discussion.
Today I want to discuss a bearish income strategy that allows you to define your risk while simultaneously using less capital. The strategy is known as a poor man’s covered put.
Most traders either short stock, which has undefined risk and can be capital intensive, or simply buy puts. However, in my opinion, a poor man’s covered put options strategy is a far superior way to take on a bearish position while defining your risk and using significantly less capital.
The trade mechanics of a poor man’s covered put are similar to that of a poor man’s covered call, but instead of using calls we use puts.
Today I’m going to go through an example, step-by-step, so we have a sound understanding on how a poor man’s covered put works in the real world.
I’m going to use the S&P 500 (SPY) as my underlying ETF, although you can use any stock or ETF with highly-liquid options.
Conceptually, poor man’s covered puts are similar to covered puts, with only a few exceptions.
Again, the main difference: poor man’s covered puts require far less capital. The strategy doesn’t require shorting 100 shares of stock. In fact, no shares are needed.
In most cases, it costs 65% to 85% less to use a poor man’s covered put options strategy. The savings in capital required should be reason enough to at least consider using the strategy. And I’m certain after reading this you will indeed find the options strategy appealing.
Like a covered put strategy, a poor man’s covered put is an inherently bearish options strategy. But again, rather than spend an inordinate amount of money to short at least 100 shares of stock, and have theoretically undefined risk, you have the ability to buy what is essentially a stock replacement. The replacement? An in-the-money LEAPS put contract.
LEAPS, or long-term equity anticipation securities, are options with at least one year left until they are due to expire. The reason we choose to use LEAPS as our stock replacement is because LEAPS don’t suffer from accelerated time decay like shorter-dated options.
The initial barrier to entry when it comes to selling poor man’s covered puts comes is security selection. Simply stated, implied volatility (IV) is one of the main keys to security selection. Implied volatility tells us how much risk and return we should expect to see over a 20- to 45-day time frame, so that we can form a realistic plan for creating monthly income.
Next is the price of the security. Just because the IV of a stock fits within our range doesn’t mean that the stock works. We must be able to establish a position while maintaining proper position size in our overall portfolio.
My preference is to buy a LEAPS (put) with a delta of roughly 0.80 and sell puts with a delta between 0.20 and 0.40. The reason is I want to give myself the ability to make some decent returns on my LEAPS contract if indeed the stock pushes significantly lower. My goal is to initiate my poor man’s covered put position with an overall delta of approximately 0.50.
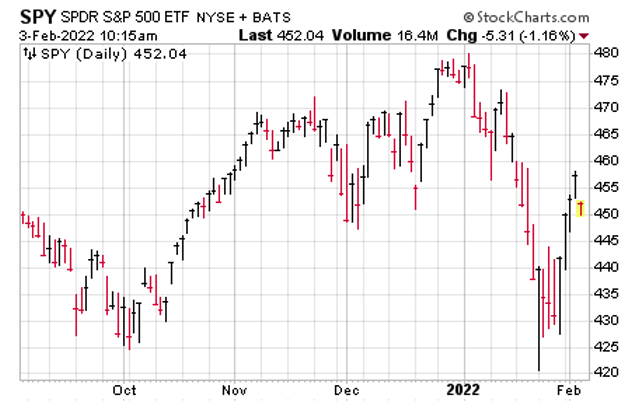
If we followed the route of the traditional covered put, we would need to short at least 100 shares of SPY. At the current share price, shorting 100 shares would cost a minimum of $45,204. For some investors, the cost of 100 shares is prohibitive, especially if diversification amongst a basket of stocks is a priority. Therefore, a covered put strategy just isn’t in the cards.
But, as I said before, with a poor man’s covered put strategy you can typically save 65% to 85% of the cost of a regular covered put strategy, making the benefits of a poor man’s covered put strategy far more affordable.
So again, rather than shorting 100 shares or more of stock, we only have to buy one LEAPS put contract for every 100 shares we wish to control.
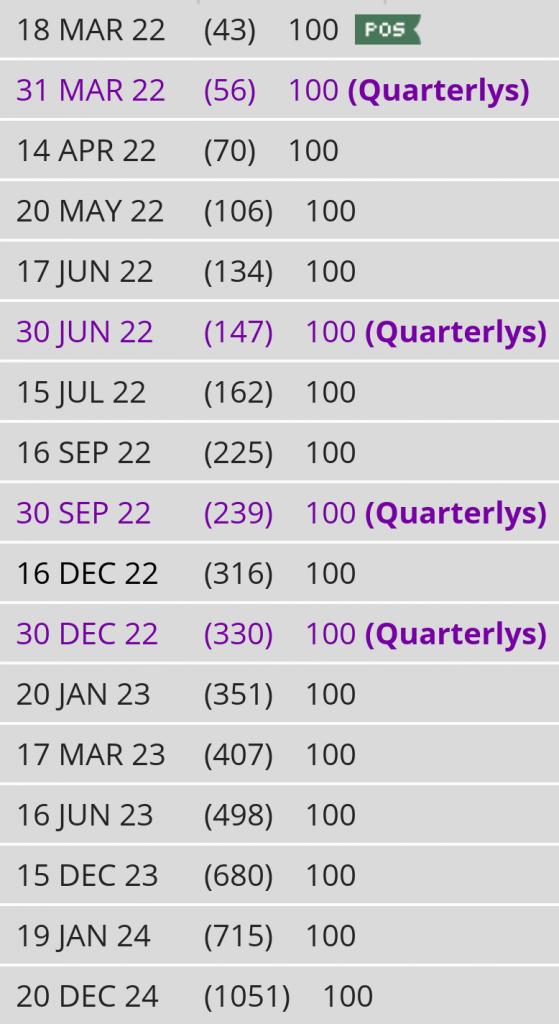
If we go with the longest-dated expiration cycle in SPY we are left with the December 20, 2024 expiration cycle with 1,051 days until expiration. However, we can also go with the December 15, 2023 expiration cycle. The latter offers us the ability to bring in income while also not tying up as much capital. Of course, our duration is shorter on our LEAPS put contract, but we can always roll out further in time when our LEAPS has roughly 8-12 months left in duration.
Remember, the reason we go out so far is to avoid any time decay, otherwise known as theta decay.
You can see the expiration cycles currently offered for SPY below.
Once I have chosen my expiration cycle, in this case the December 15, 2023, I then look for an in-the-money put strike with a delta of around 0.80.
When looking at SPY’s option chain I quickly noticed that the 515 put strike has a delta of 0.77. The 515 put strike price is currently trading for approximately $83.00. Remember, always use a limit order. Never buy an option at the ask price, which in this case is $84.94.
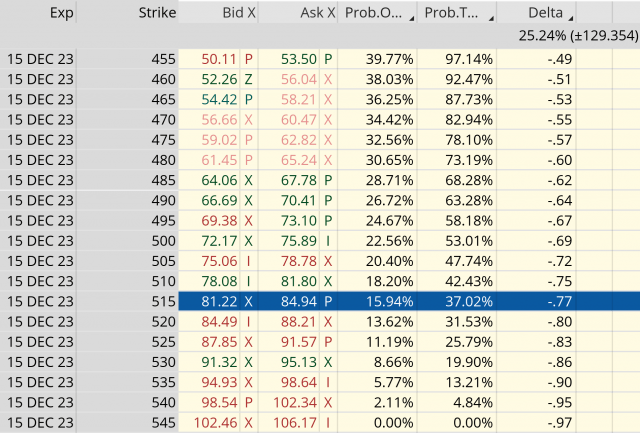
So, rather than spend $45,204 for control of 100 shares of SPY, we only need to spend $8,300. As a result, we are saving $36,904, or 81.6%. Now we have the ability to use the capital saved to diversify our premium or income stream amongst other securities if we so choose.
After we purchase our LEAPS put option at the 515 put strike, we then begin the process of selling short-term puts against our LEAPS. This will allow us to not only create a steady income stream, but also lower the cost basis of our overall position.
My preference is to look for an expiration cycle with around 30-60 days left until expiration and then aim to sell a put strike with a delta ranging from 0.20 to 0.40, or a probability of success between 60% to 85%.
As you can see in the options chain below, the 435 put strike with a delta of 0.30 falls within my preferred range.
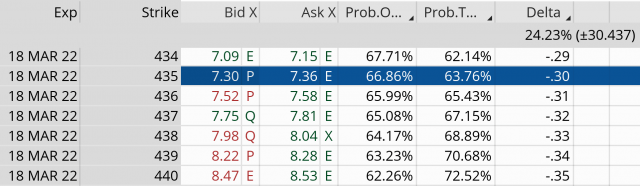
We can sell the 435 put option for roughly $7.32.
Our total outlay for the entire position now stands at $7,568 ($8,300 – $732). The premium collected is 8.8% over 43 days. That’s a decent amount of premium, especially if you consider we are only going out 43 days.
But, if we were to use a traditional covered put our potential return on capital would be well below half, or 1.6% over 43 days, and we would be faced with unlimited risk, theoretically of course.
And remember, the 8.8% is just the premium return, it does not include any increases in the LEAPS contract if the ETF pushes lower. Moreover, we can continue to sell puts against our LEAPS position until there is roughly 10 to 12 months of life left in the LEAPS, thereby generating additional income or lowering our cost basis even further.
As an aside, an alternative way to approach a poor man’s covered put if you are a bit more bearish is to buy two LEAPS for every put sold. This will increase the delta of your overall position and allow you to benefit from the additional downside past your chosen short put strike, yet still participate in the benefits of selling premium.
Regardless of your approach, you can continue to sell puts against your LEAPS as long as you wish. Whether you hold a position for one expiration cycle or 12, poor man’s covered puts give you all the benefits of a covered put for significantly less capital.
Poor Man’s Covered Put Trade:
- Buy SPDR S&P 500 ETF (SPY) December 15, 2023 515 LEAPS put contracts for roughly $83.00
- Sell SPDR S&P 500 ETF (SPY) March 18, 2022 435 puts (43 days until expiration) for $7.32, or $732 per contract
Static or Return on Premium: 8.8% over 43 days, or 70.4% annually
Initial Breakeven: $75.68, or $7,568
So, as you can see above, we have the potential to create 8.8% every 43 days, or approximately 70.4% in premium a year using SPY.
As always, if you have any questions, please do not hesitate to email me or post a question in the comments section below. And don’t forget to sign up for my Free Weekly Newsletter for weekly education, research and trade ideas.
