Farewell, vain world! I’m going home!
My Savior smiles and bids me come,
And I don’t care to stay here long!
Hello from the Google campus Starbucks, where I again take keyboard in hand to share some bearish thoughts for the week ahead. Thanks to my precious SlopeCharts, I am able to share some ideas related to worldwide markets, which I think create a pastiche of ursine possibilities.
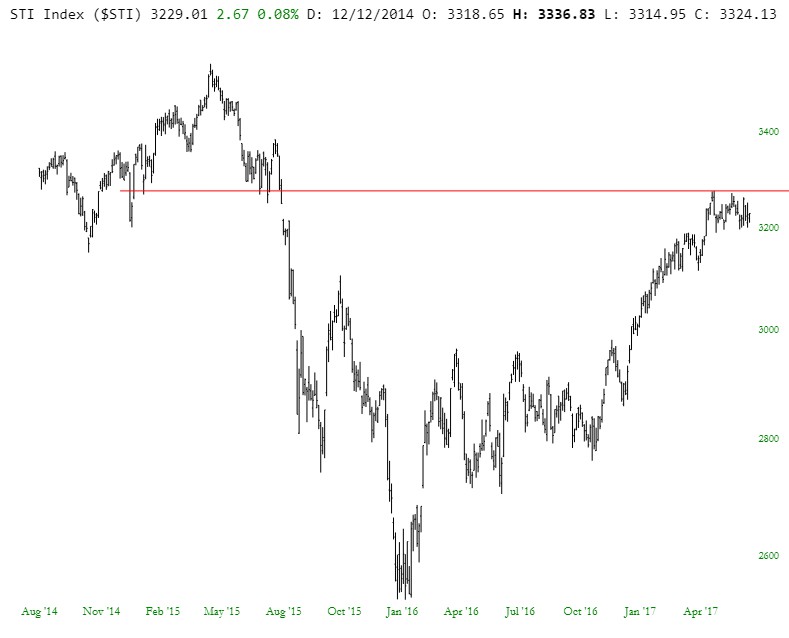
Broadly speaking, I am seeing three different kinds of situations with these international indexes. Some of them had bullish breakouts which have since failed. Others are at extremely high prices relative to their broad histories. And others, like the Straits Times Index below, are getting repelled by overhead supply.