
I’ve had a gum infection this week and that has been affecting my sleep patterns and my powers of concentration. Hopefully it will mostly have passed by tomorrow, as it has definitely improved from yesterday to today.
I’m getting a post out before I go to bed tonight though because there is likely to be an important inflection point coming this week, possibly as soon as tomorrow, and everyone should be aware of that.
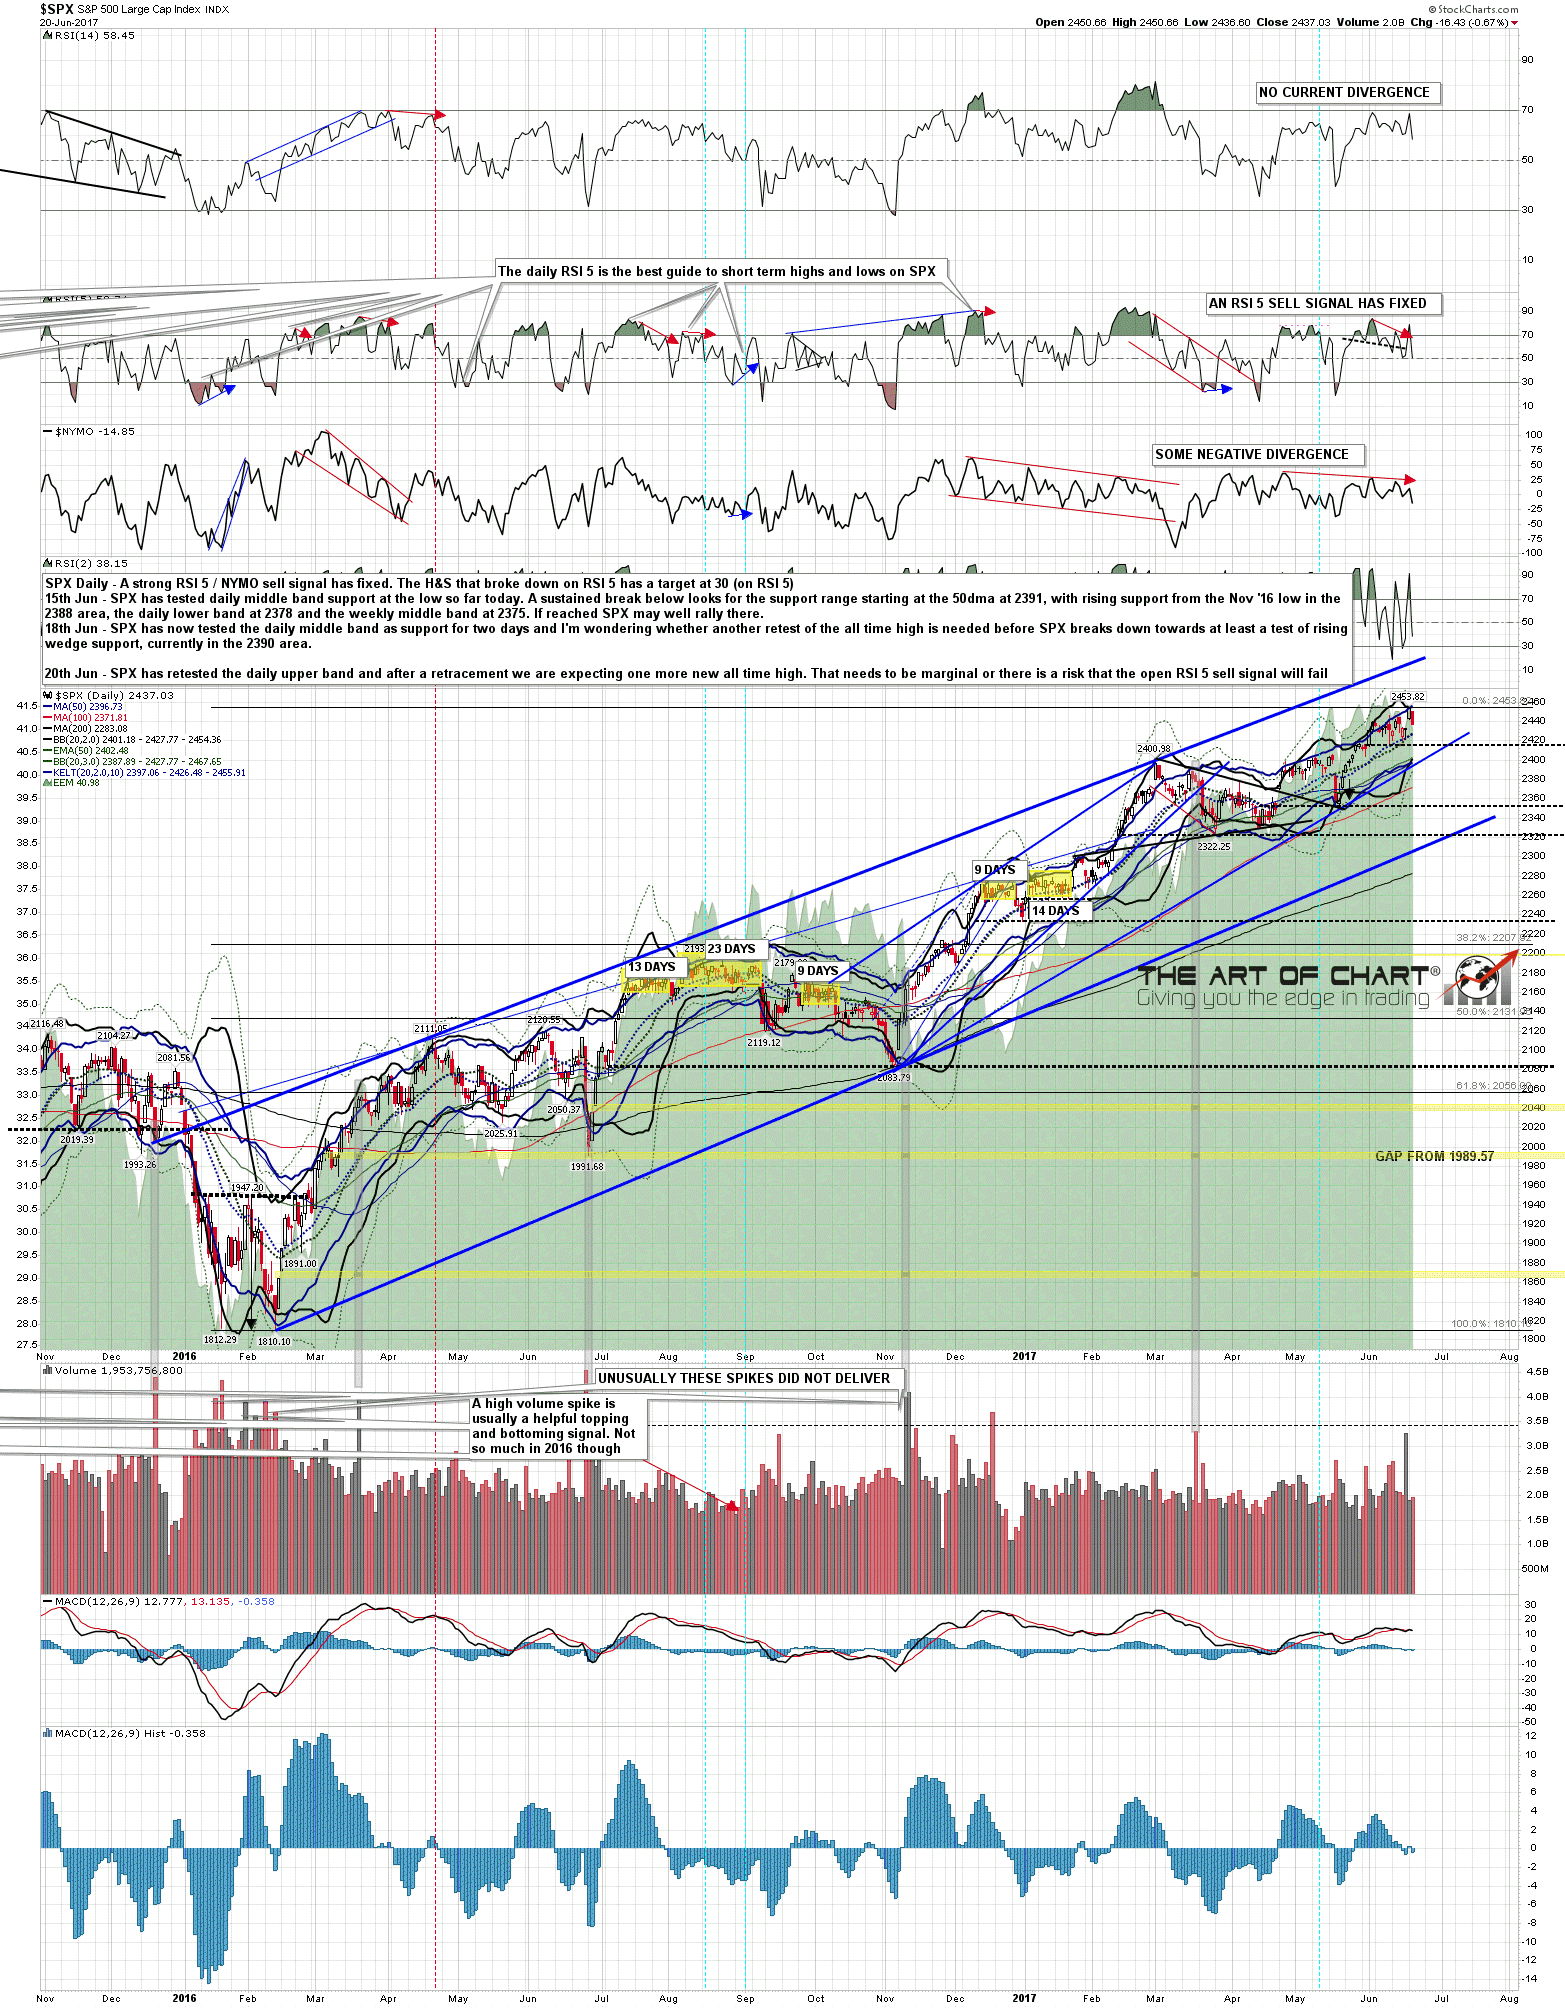
The short term picture on SPX / ES is that a triangle formed last week and broke up yesterday. I look at that more closely on the ES chart below but the way these generally work is that you see the initial break up (yesterday), then a backtest back into the triangle (today – possibly completed), and then a thrust up to a higher high, at which point we hit the inflection point that I’m looking at this week. When the triangle thrust ends the thrust is usually entirely retraced.
The distance covered by the triangle thrust isn’t something where any meaningful target can be calculated. These vary from marginal higher highs to significant new impulses up, so resistance levels and the pattern of the thrust up will be important.
SPX tested and held the daily middle band as support on Thursday and Friday last week and that always risks a return to the daily upper band, which was retested at the new all time high on Monday. There is a decent case that the triangle thrust just retests that high and likely makes a marginal new high, and I’ll explain why that is on the NDX daily chart. SPX daily chart:
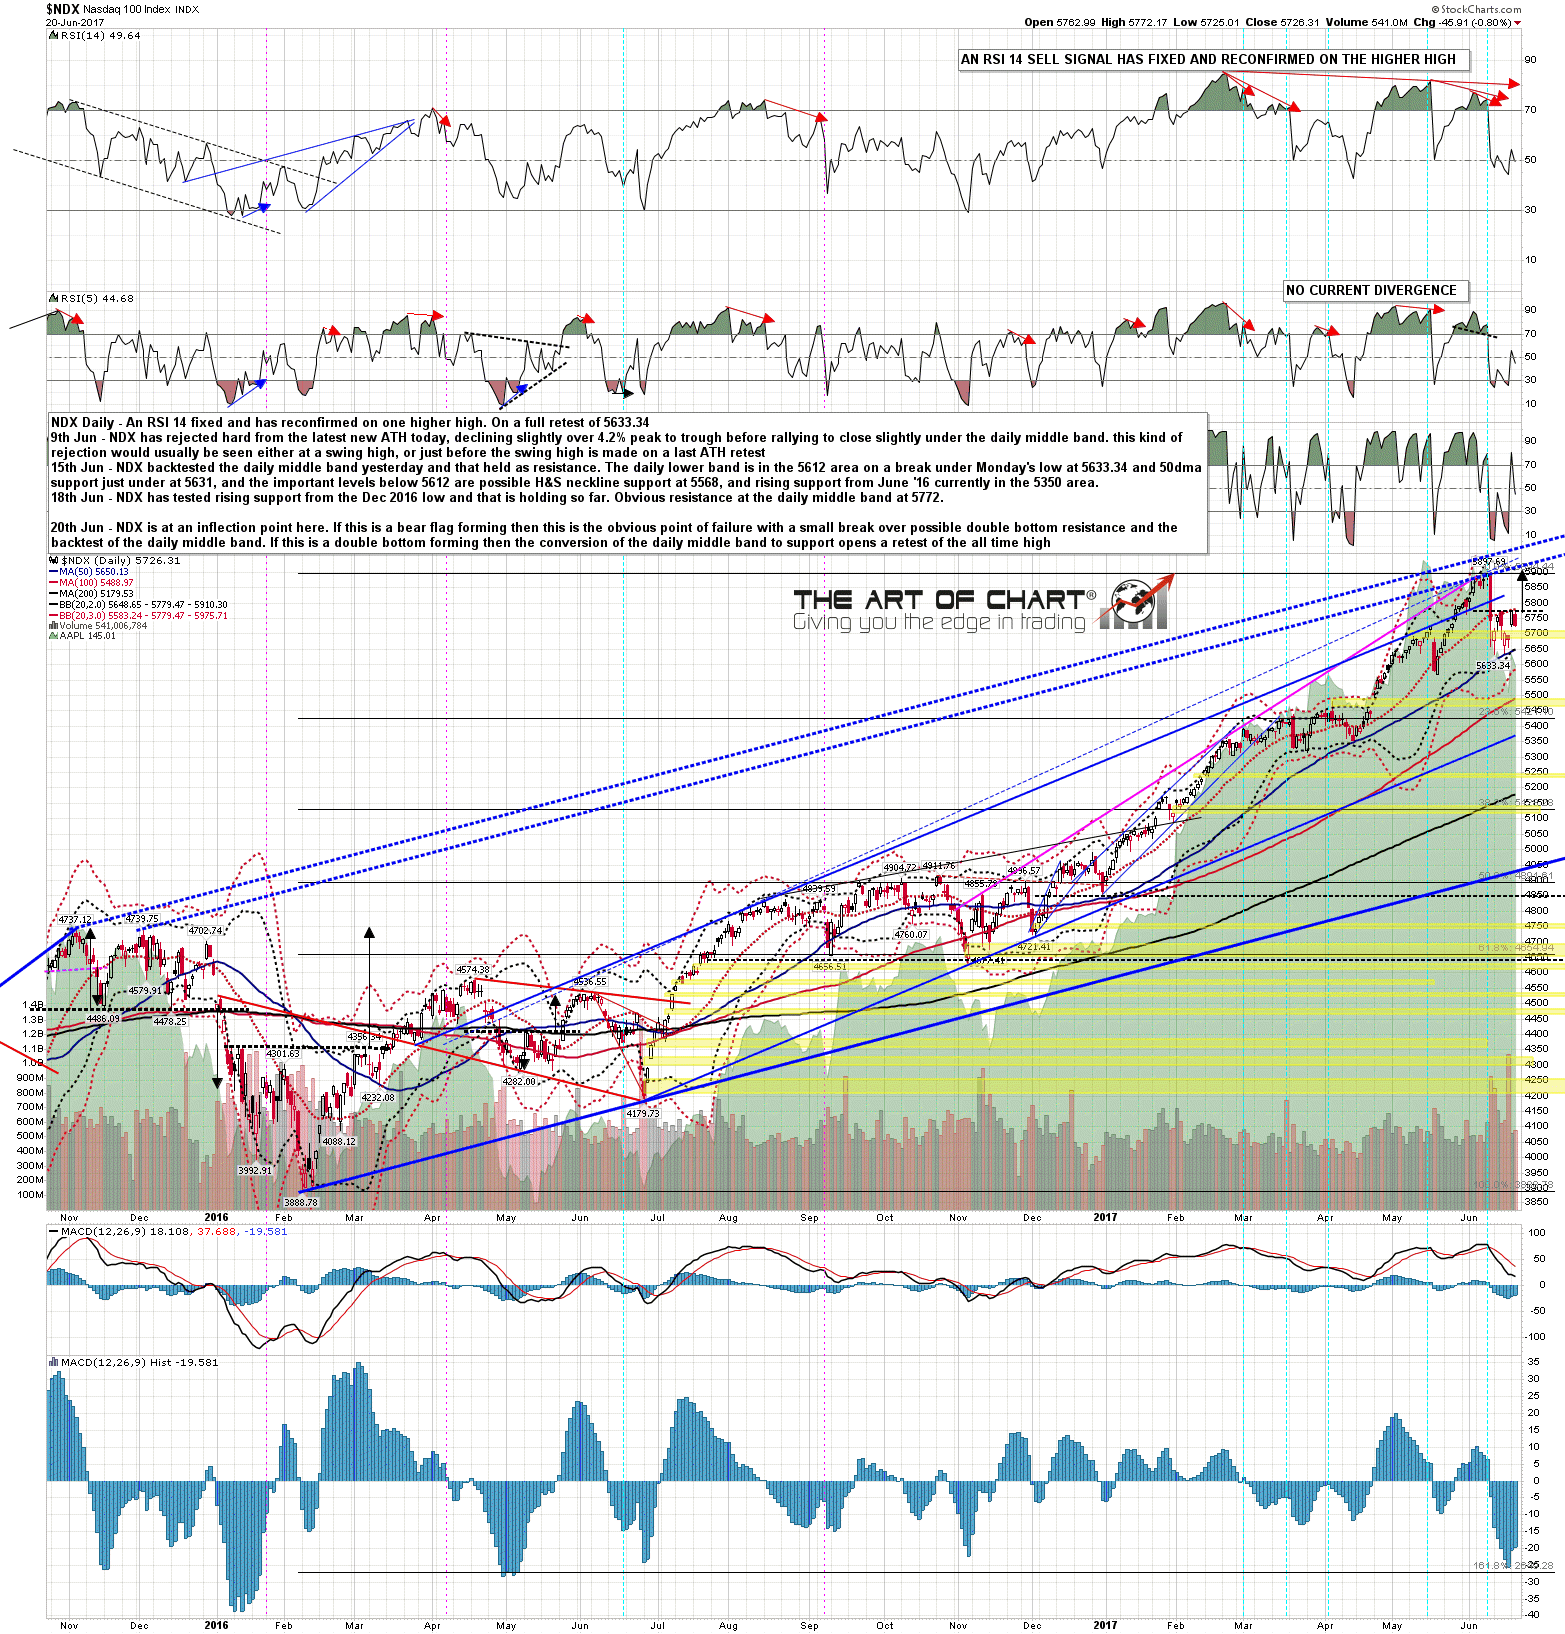
The inflection point is very clear on this NDX chart. A possible double bottom setup has formed, and NDX has broken slightly over double bottom resistance before retracing today from the test of the daily middle band as resistance. As long as the daily middle band holds as resistance then this is a bear flag forming with a minimum target at a retest of last week’s lows. On a break above the daily middle band, and conversion to support, this is a double bottom with a minimum target at a retest of the all time high. That is the key inflection point this week, as SPX is leading both NDX and RUT by such a distance this week so far that a retest of the ATH on NDX would likely propel SPX up by twenty or more handles, putting a push to 2470-80 into range. NDX daily chart:
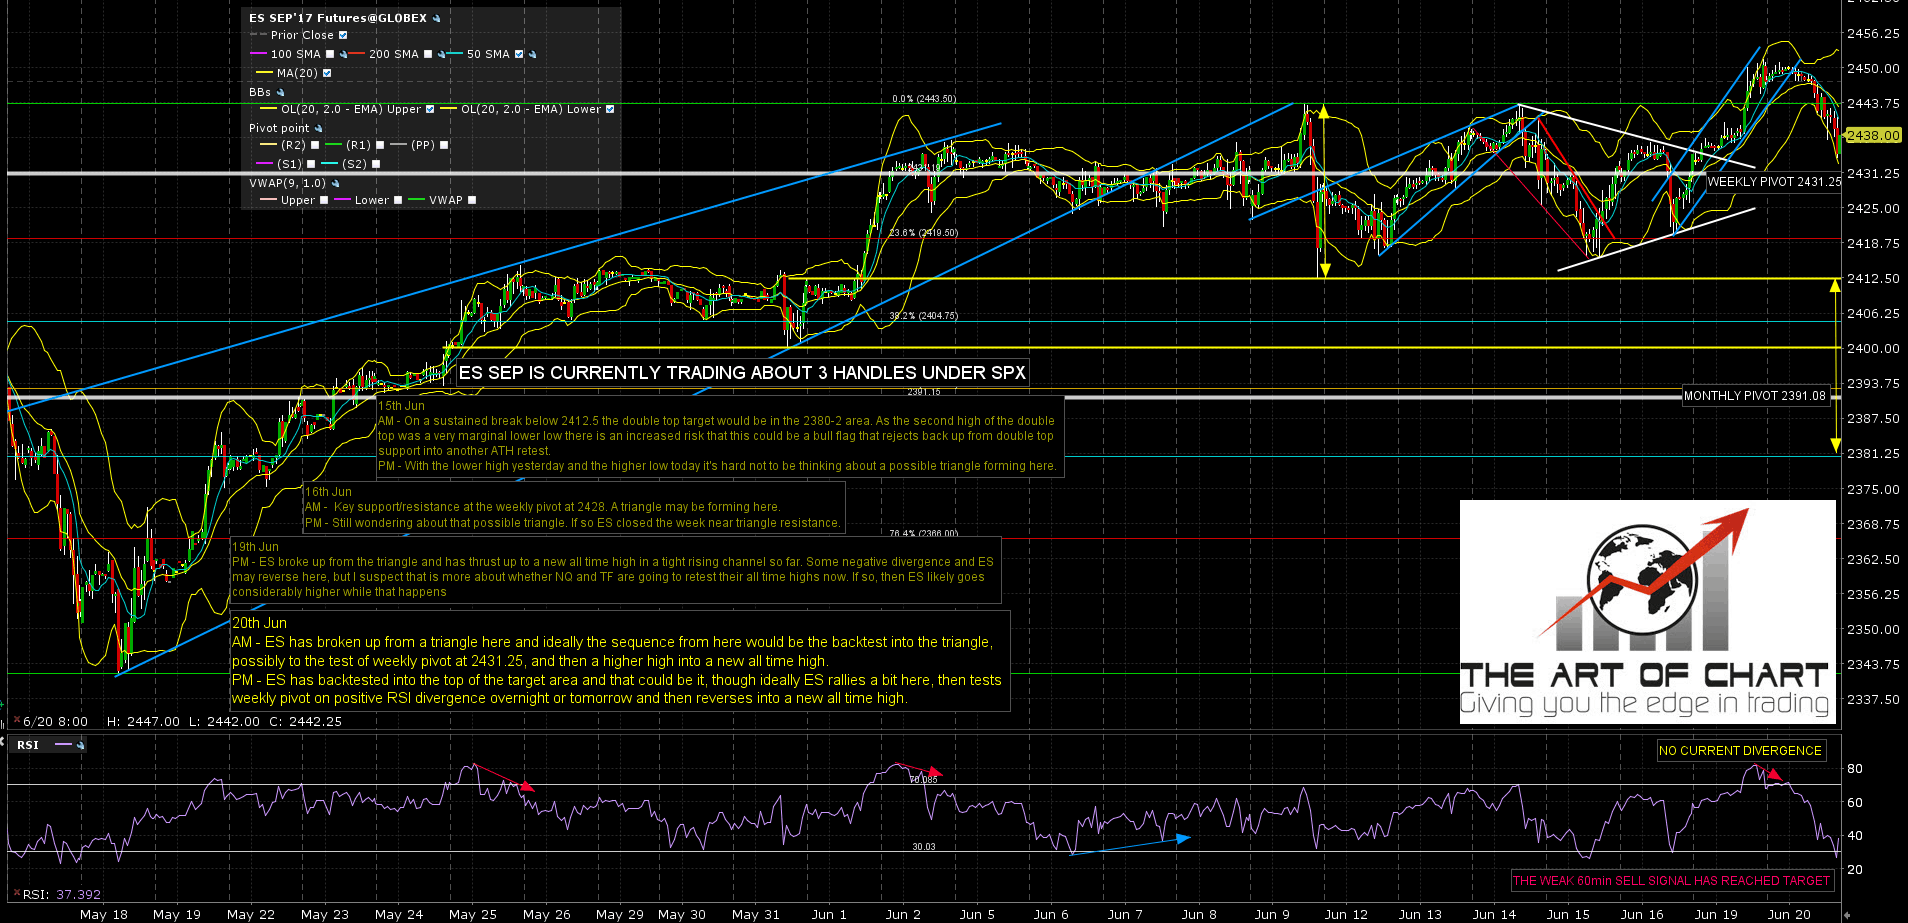
The ES and NQ futures charts below were done after the RTH close for Daily Video Service subscribers at theartofchart.net. If you are interested in trying our services a 30 day free trial is available here.
You can see the triangle clearly here on ES, and the retracement today tested the top of the target range. That may be enough, but ideally today’s decline follows through tomorrow to the ideal retracement target at the weekly pivot at 2431.25. If so the odds are decent that that a 60min buy signal would be brewing at that test. ES Sep 60min chart:
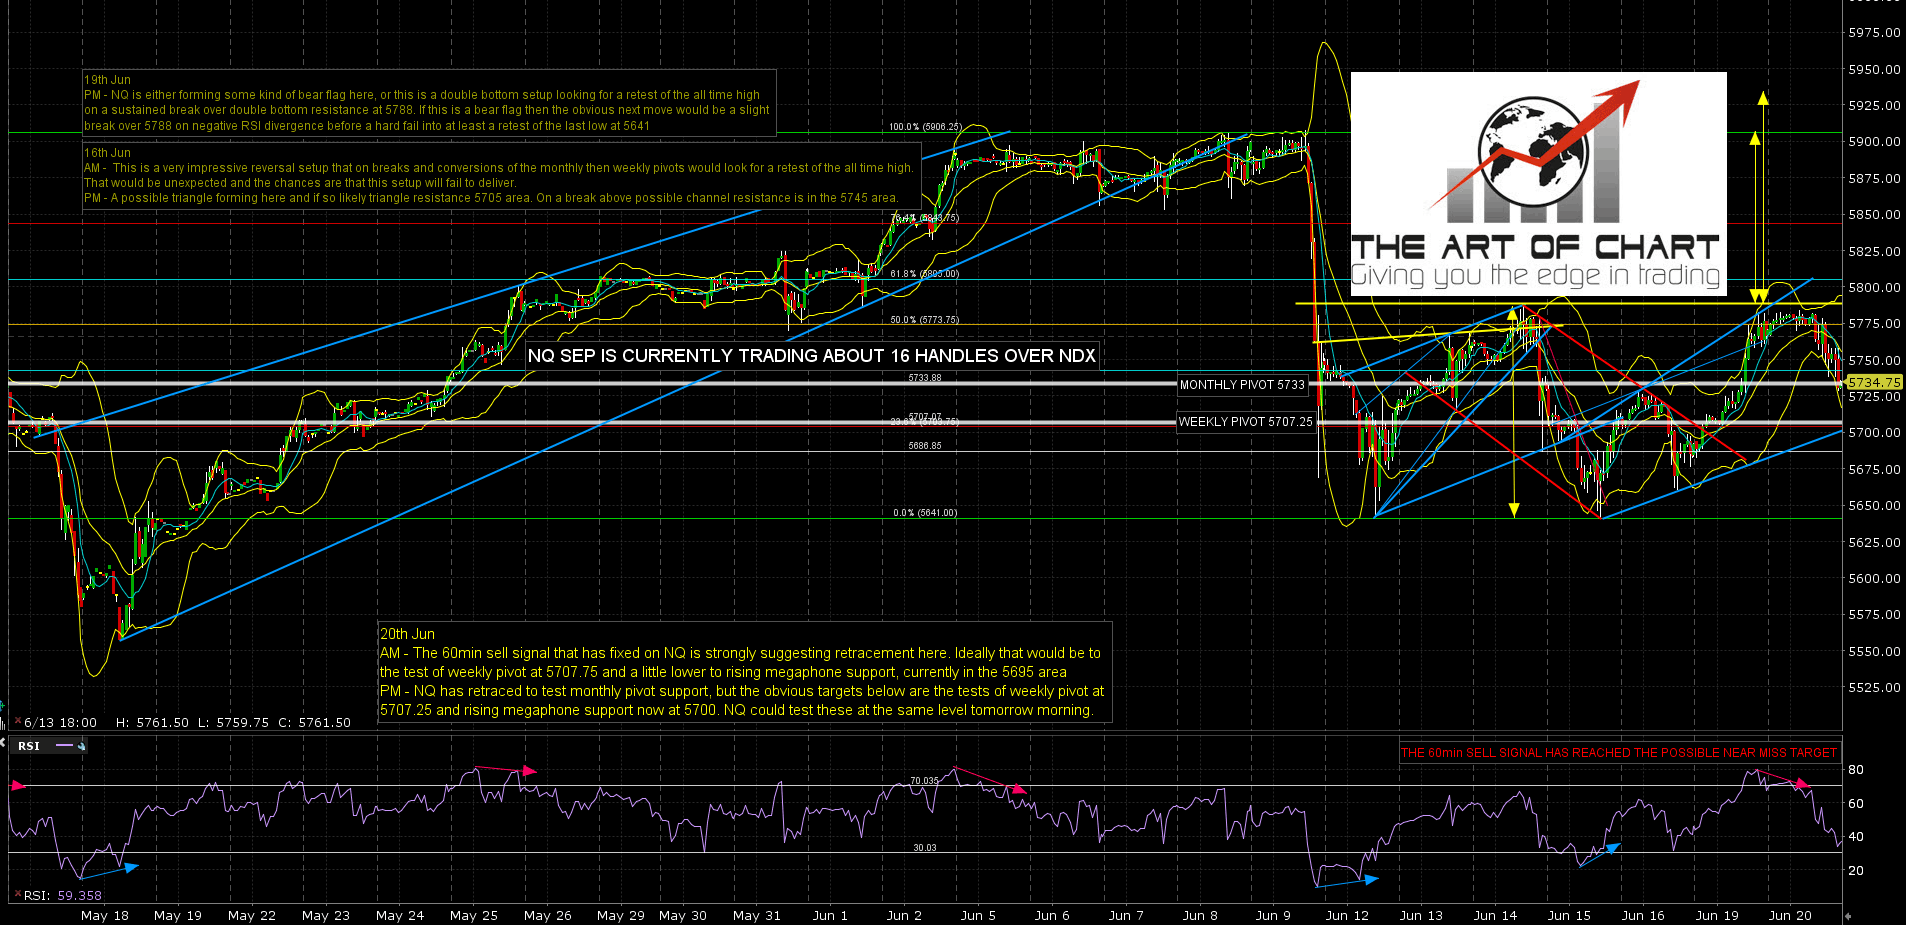
NQ reached the test of the monthly pivot at the low today. The ideal retracement target again on NQ would be the weekly pivot at 5707.25, and that is made more attractive as a target by rising megaphone support likely crossing the weekly pivot tomorrow morning. Again, if that target is reached a 60min buy signal might well be brewing there. NQ Sep 60min chart:
TF was interesting today for a couple of reasons. The first reason is that there was also a compelling case that a double bottom was forming with a target at a retest of the all time high on TF. That double bottom broke up slightly through resistance and then retraced most of the way back to last week’s low today. This is therefore what I would call a Janus bear flag, with a minimum target at a full retest of last week’s lows. If we are to see that tomorrow then that supports a bit lower on ES and NQ.
The second reason that TF was interesting today is that there is no longer a strong bull setup on TF for an all time high retest. That weakens the case for an all time high retest on NQ, though TF is still currently in a possible bull flag channel with the same target of course. TF Sep 60min chart:

Is there a possibility that the indices break down directly from here? Unlikely but I’d still put the odds of that at 20%. If that is going to happen then those weekly pivots will be broken and converted to resistance, and that will signal the early failure. That’s very much the alternate scenario here though. This retracement likely ended at the lows today or ends a bit lower tomorrow, and after that we should see a new all time high on SPX and maybe higher from there, if NDX adds fuel to the move by breaking over the daily middle band. We’ll see what happens at that point.
